Doing More with Less in the Public Sector
williamghunter.net > Articles > Doing More with Less in the Public Sector
A Progress Report from Madison, Wisconsin
by William Hunter, Jan O'Neill and Carol Wallen
Center for Quality and Productivity Improvement, University of Wisconsin, Report No. 13, June 1986. Also published in Quality Progress, July 1987, pp. 19-26.
Abstract These days there is a considerable amount of discussion on new ideas for improving quality and productivity in organizations and the need for a complete transformation of the way these organizations are managed. Such discussions are almost always couched in terms of organizations in the private sector. There are compelling reasons for believing that significant improvements in quality and productivity can also be made in organizations in the public sector. This report describes some experiences gained in city and state governments in Madison, Wisconsin, in using these new methods and provides some practical guidelines for getting started elsewhere.
Keywords: Quality improvement; Productivity improvement; Public sector; Case studies; New management philosophy; Human resource management; Scientific method; Statistical techniques; Process improvement; Problem-solving; Teamwork.
These days there is a considerable amount of discussion on new ideas for improving quality and productivity in organizations and the need for a complete transformation of the way these organizations are managed. Such discussions are almost always couched in terms of organizations in the private sector. There are compelling reasons for believing that significant improvements in quality and productivity can also be made in organizations in the public sector. This report describes some experiences gained in city and state governments in Madison, Wisconsin, in using these new methods and provides some practical guidelines for getting started elsewhere.
Introduction
In the past decade, the City of Madison's Motor Equipment Division lost six staff positions (down from 35 to 29), while the number of vehicles it serviced grew from 546 to 725. Just this year, state agencies in Wisconsin were directed to slash 7.7% from their operating costs because a slower-than-expected economy had led to a projected $350 million revenue shortfall. Across the country, belt-tightening is now the rule in the public sector as the growth rate of tax revenues drop and services are shifted from the federal government to state and local levels. Whatever the reason, public administrators are being asked to "do more with less"-to maintain, or even increase productivity in the face of budget and staff cuts.
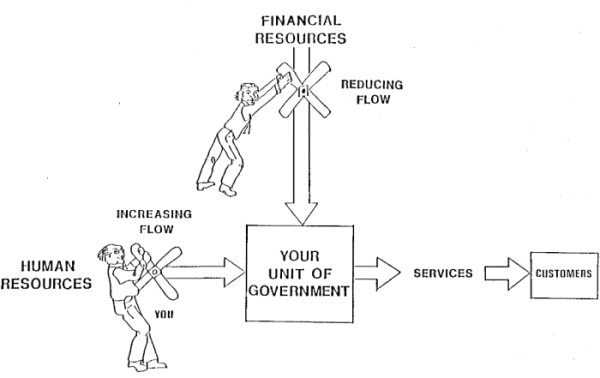
The key idea is to compensate for dwindling financial resources by getting the most out of human resources (see Figure 1). Some state and municipal leaders have boldly allocated portions of their dwindling budgets to educate themselves and their employees in the basics of quality improvement methods advocated by W. Edwards Deming, Kaoru Ishikawa, Joseph M. Juran, and others. People in their organizations are learning how to work smarter-not harder.
Quality improvement, whether in public or private sectors, demands three major changes. First, it calls for a total transformation of management philosophy so all employees can focus on the never-ending improvement of quality. Second, quality improvement means making decisions based on data, not just on hunches and guesses. All employees must scrutinize all key processes in the organization to determine where and how they break down and how they can be improved. Third, improving quality requires an almost fanatical devotion to customers.
The goal is to meet-and preferably exceed- customers' needs and expectations. Traditional American management philosophies have become obsolete. Most managers in this country have been taught how to control rather than lead (Joiner and Scholtes, 1986). They give the direction and establish the controls that everyone else follows. This entrenched management style, developed in the mid-1800's, is, surprisingly, the last real innovation in American management. Well over a century later we're still using methods developed with the help of the military by railroad barons, the first managers of large, complex business organizations in this country (Chandler, 1977 and Scholtes, 1986).
The most destructive feature of management by control, with its militaristic overtones, is the fear it engenders and on which it depends. Commands and information flow one way-from the top down- inhibiting employees lower on the ladder and discouraging them from contributing their ideas and talents. After all, how often does a general listen to a private? It is essential that fear be removed from the workplace. Then employees can begin to feel comfortable in using their creativity and talents to solve problems.
Fear, however, is just one of the problems caused by traditional management practices. Managers typically focus on the final product or service. In the public sector this focus translates into a reliance on audits, reviews, and hearings: attention that comes too late, allowing resources to be wasted on error-inspection rather than error-prevention. (For example, McDonnell Douglas was subject to 6000 separate government audits in 1985-meaning three new audits started every hour of each working day that year!)
Plans to increase productivity also go awry. When quality is only a secondary focus, managers typically try to get more for their dollars by either cutting costs or increasing quotas and exhorting their employees to work harder. The end result is the exact opposite of the goal: slashing funds or raising quotas almost always causes a drop in quality, which in turn means more rework and discouragement for the front-line workers. Productivity begins to fall, and managers get trapped in the blame game, "Who's at fault? Can't you work harder?" Since employees have no control over this situation, they tend to disassociate themselves from their work, no longer taking pride in the quality of what they do.
One requirement for changing these damaging management practices is to permit employees to take pride in their work. They need to become involved in making decisions, and their contributions need to be acknowledged. Managers and workers need to become team members who are all pulling in the same direction. But employee involvement alone is not enough.
A second requirement for all employees and managers is to use a scientific approach for improving processes and solving problems. Data can be collected and analyzed by teams of managers and employees working together to reduce-and ultimately prevent-problems. To learn how to do this work requires considerable training. Even teamwork and a scientific approach are insufficient to transform old-style management practices. The final key requirement is to build quality into every step of every process, from design to execution.
Nothing is perfect; processes can always be improved. Quality therefore demands continuous, never-ending attention. Closer attention must be given to internal customers, the people within the organization who are the recipients of products produced by co-workers, and to external customers, the ultimate beneficiaries of the work being done. Who are they? What do they want? The answers to these questions will point the way to quality improvement.
What happens when the primary focus is on quality? As quality improves, the amount of rework and repair drops and employees are able to use their time more effectively. This approach leads to an increase in productivity and a drop in costs. To show how this focus on quality has worked in the public sector, we next summarize two examples.
Quality Improvement in Action: First Street Garage (Municipal Service)
In November 1983, a Madison city audit highlighted poor productivity, labor-management relations, and inter-departmental communications in the Motor Equipment Division of the city's Department of Public Works. Efforts to improve the situation had repeatedly failed in the past. The auditors recommended they use some quality improvement techniques in the division. A few months earlier, David E. Miller, an aide to Mayor F. Joseph Sensenbrenner, had attended a seminar organized by the University of Wisconsin- Madison and presented by W. Edwards Deming.
Recognizing that Deming's mandate for quality improvement was as true for governmental agencies as it was for industries, he convinced the mayor and city council to appropriate a portion of the 1984 budget for instruction in and trials of Deming's approach. Peter Scholtes, a city employee who was a specialist in organizational development, learning of the audit's recommendation and of Miller's budget proposal, combined the two and began a push for getting this new management approach used at the First Street Garage (the primary facility of the Motor Equipment Division). With additional support from Miller and Mayor Sensenbrenner, the program was up and rolling by March of 1984.
Initially, four employees from the Motor Equipment Division met with Peter Scholtes, and later also with Bill Hunter, a professor from the University of Wisconsin-Madison. The team spent the first meetings learning the fundamentals of quality improvement. They initially proposed "morale" as a problem that desperately needed attention, but Scholtes suggested that if they stuck with more concrete targets, morale would probably take care of itself. Heeding this advice, the team chose to focus on two areas: customer research and causes of vehicle downtime. With the addition of several other employees, they then split into two separate groups.
The customer research team interviewed supervisors in five "user" agencies and surveyed other agency employees and managers by mail using a random sample. Through another survey of the above groups, the city's common council, and the Board of Public Works, the customer research team was able to rank repair priorities. Since the customer research team was convinced the surveys would be an open invitation to criticize the division unmercifully, they approached their tasks with some trepidation. The customers rated the overall quality of Motor Equipment's service above the employees' expectations, which resulted in a boost to the employees' morale. Another surprise for the employees was that "safety" appeared at the top of every customer's priorities, not "repair coses" as had been assumed (repair cost ranked sixth out of seven possible answers). Employees at the First Street Garage were glad to learn of this result because they had long felt dissatisfied when they were forced by the "hurry-up" atmosphere to put vehicles back into service that they judged to be unsafe. As expected, customers identified the division's biggest problem as "duration of downtime."
Even before these surveys were finished, the downtime group had begun its task. What in their process caused long repair delays? The team flow charted the entire process, defining fifteen steps from the time a vehicle was brought in until it was put back in use (see Figure 2). These steps were then listed on checksheets which were subsequently used by the division to track equipment passing through the garage over a one-month period. The checksheets helped the team to see how long each step took by type of vehicle, customer and repair priority.
The team then examined these checksheets. They discovered that 28% of a low-priority vehicle's time was spent in the lot waiting for repairs to begin. Further, about 15% of all vehicles' time in the garage was spent waiting for parts to be delivered. Some of this latter delay was caused by problems in Motor Equipment's "parts" room, but since the system was being computerized, the group was convinced they should wait until the conversion was complete before tackling the parts problem.
At this point many teams would have moved immediately to start looking for solutions. (Tempting as it may be, such an approach is often inefficient in the long run.) The Motor Equipment team, however, guided by Scholtes and Hunter, decided to dig for underlying causes of excessive vehicle downtime. They found that: (1) vehicles were being replaced on the average less frequently than a decade ago (every 21 years for non-police vehicles now vs. every 10 years before), and thus the fleet was aging rapidly-based on the fact that approximately 5% of the fleet was currently being replaced each year; (2) the division had lost six staff positions during a period when the fleet had grown enormously; and (3) other agencies, also suffering staff cuts had been buying "high-tech" equipment that required fewer operators but was more expensive to repair and maintain. To make matters worse, for the past two decades the division had operated under an "if it ain't broke, don't fix it" policy handed down from the early 1960s. Minor problems, therefore, had to become major before they could be handled.
With these and other carefully documented facts to support their case, the mechanics personally persuaded the City Council and the Mayor to reinstate a preventive maintenance program deleted from the City budget twenty years before. The mechanics predict savings will grow and downtime will decrease as small problems are caught early.
The downtime team recommended other steps that helped reduce downtime. They had their customers develop a "repair priority" list (which repair jobs take precedence?), they established agency contacts to facilitate communications, and they streamlined repair procedures.
However, it is painting too rosy a picture to imply every employee is now "on board" and every customer satisfied. Some employees not on the project teams were unhappy about being excluded and having to pick up their colleagues' work when those team members met. (To alleviate this problem, more people have been either added to project teams or encouraged to join future teams.) The division has also had to deal with resentment from customer agencies whose vehicles are now designated as low priority. Making decisions about priorities-and sticking by them-has often put Motor Equipment personnel in tough spots.
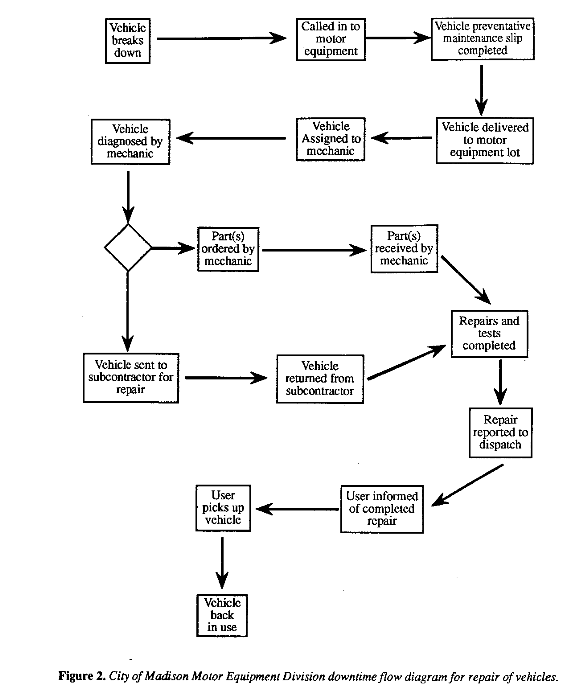
Figure 2. City of Madison Motor Equipment Division downtime flow diagram for repair of vehicles.
Word Processing Pool (State Service)
Imagine sending a one-page letter to a word-processing pool and getting it back two or even three weeks later-with errors. Now imagine coming to work each day and having to face an entire wall of floor-to-ceiling shelves packed with a backlog of typing requests. Such was the dismal reality faced by customers and operators of the Compliance Bureau of the Wisconsin State Department of Revenue. They tried countless adjustments, but the turnaround time stubbornly remained at unacceptably high levels. Communication and trust kept deteriorating and employee turnover rates continued to rise.
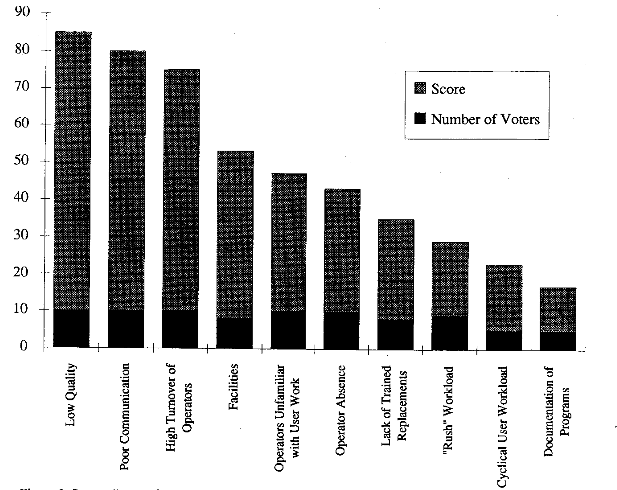
Figure 3. Pareto diagram for nominal group results of Wisconsin Slate Department of Revenue word processing team.
In June 1985, the Department of Revenue began its first wave of quality improvement projects and the word processing problem was a main target. Nine people participated on a quality-improvement team: the bureau director (now division administrator), three section chiefs (representing the "customers"), the word processing supervisor, three operators, and a systems analyst. The team met weekly for three months.
The first meeting broke new ground for all team members. It was the first time operators had sat down with managers to analyze word processing tasks and to identify all their customers and suppliers. To maximize individual input, the team completed a nominal group exercise (Delbecq, Van de Ven, and Gustafson, 1975): brainstorming problems, then listing, discussing and clarifying ideas, and eventually ranking problems in order of importance (see Figure 3). Since all team members ranked "low quality" as the number one problem, the team mapped the possible causes of poor quality on a cause-and-effect diagram, as shown in Figure 4 (Ishikawa, 1982). The primary problems in their jobs were illegibility, missing information, spelling, punctuation, grammar, missing signature, and repeated use of a single form for different typing requests. This request form was the crucial link between customers and operators, and when the forms were improperly filled out, operators had difficulty ascertaining what the customers really wanted. The result was product of poor quality.
To pinpoint where problems were occurring, the team broke into two groups (customers and operators evenly distributed in each group). Each drew a flowchart for the entire process. These two were merged into a single flow chart, which proved to be an excellent vehicle for communication. The team used the chart to focus discussion on specific points. From these discussions, the team decided to collect two types of data. The section chiefs conducted a customer survey to find out what the users wanted and expected; the operators developed and used a checksheet to track each work order as it passed through the word processing unit so they could locate where different kinds of errors occurred.
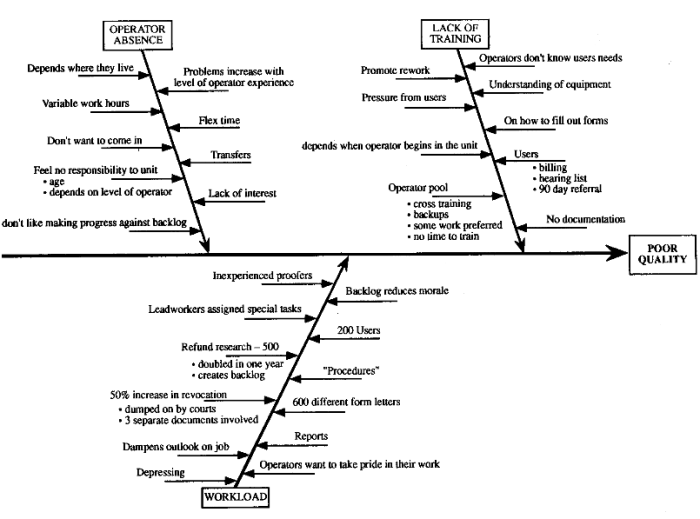
Figure 4a. Wisconsin Slate Department of Revenue word processing team cause and effect diagram showing operator absence, lack of training and workload as the major causes of poor quality.
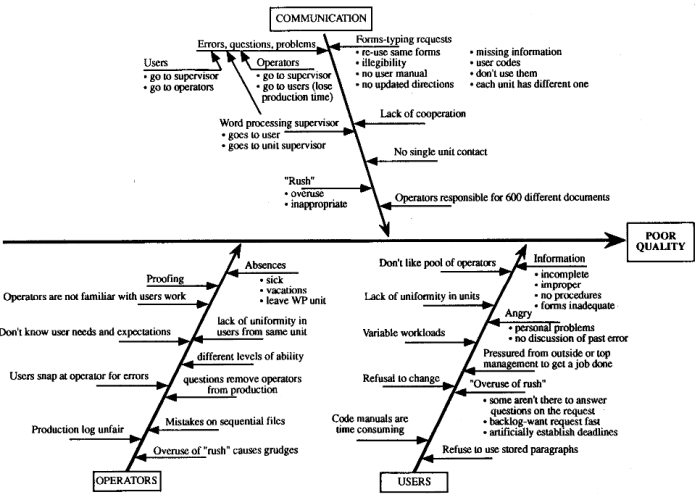
Figure 4b. Wisconsin Slate Department of Revenue word processing team cause and effect diagram showing how communication, operators and users affect poor quality.
The results of the customer survey indicated that collectively the users estimated that they submitted about 2900 documents per week to the pool and that about 18 percent of the documents contained errors when first returned. These customers ranked the pool "adequate" on overall quality (see Figures 5 and 6), and further indicated quick turnaround time, accuracy, completeness, and correct format were highly important "quality" characteristics.
Using checksheets, the operators gathered data for two weeks. They noted times in and out for all documents, sources of requests, and problems encountered. Over these two weeks the actual workload was about 7900 documents (from over 1900 requests) - or over 35% more documents per week than the customers had estimated. Moreover, the time covered was a slow work period! Of the 1900 typing requests, 27% had errors caused by the customers. (For a breakdown of errors see Figure 7.)
In subsequent weeks, the team segregated typing requests into REGULAR and RUSH piles and examined the flow of work by customer unit. They found that 49% of all typing requests were designated RUSH when submitted, with one unit alone accounting for more than half of that total. This unit's employees, fearful they would miss a legally mandated 15-day turnaround for correspondence, marked all requests RUSH. These requests clogged the normal channels, and were in fact one of the primary causes of the two to three week turnaround time.
With data in hand, the section chiefs enacted a requirement that the RUSH designation be used only for documents needed within two days. They also monitored the RUSH baskets to prevent customers from undercutting this new policy. At the same time, word-processing operators were given the authority to reject illegible or incomplete requests. Another essential step was allowing the operators to work overtime on two Saturdays to eliminate the backlog. The team was further able to reduce the workload after an inventory they took of typing requests showed the pool was handling requests that should have gone to other units. This inventory also helped customers and operators anticipate peak workload periods.
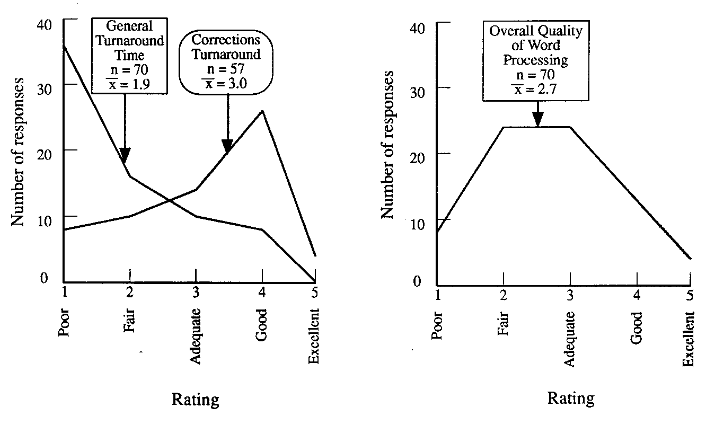
Figure 5. Wisconsin State Department of Revenue word processing customer survey (n = number of responses and X - average rating): general turnaround time and corrections turnaround.
Figure 6. Wisconsin State Department of Revenue word processing customer survey (n - number of responses and X = average rating): overall quality of word processing.
Following these changes, the turnaround time quickly decreased to two days, reaching (and staying) at eight hours soon thereafter. (Recall that the original turnaround time was two to three weeks.) The customers and operators continue to meet voluntarily once a week to continue the improvement process.
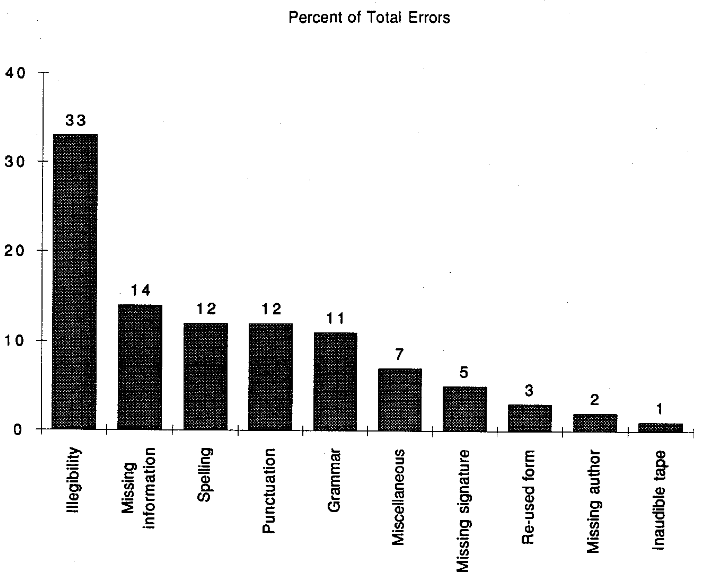
Figure 7. Wisconsin State Department of Revenue word processing team data on types of errors.
Reflections: Patterns Seen, Lessons Learned
The initial successes in the Motor Equipment Division and Department of Revenue have inspired many other municipal and state agencies in Madison to give quality improvement techniques a try. In the City of Madison and the Department of Revenue themselves, much additional activity has taken place. Most, but not all, projects have been successful. We've learned valuable lessons by comparing the more successful projects and project teams with those that were less successful.
More progress has been made by teams with some or all of the following ingredients:
Selected projects -
- were clearly linked to customer needs
- were important to the employees
- were manageable, neither too large nor too small
- concerned processes responsive to changes
- focused on statistically measurable processes rather than on policies or attitudes
Selected teams -
- included line-workers who had hands-on experience with the studied processes had supervisors and managers committed to
- included union representatives when appropriate
- became enthusiastic about their participation and communicated this enthusiasm to employees not on the team
- were guided and coached by neutral third-party "facilitators" who were able to keep teams focused on the data and underlying causes of problems
Let's take a closer look at each of these ingredients.
Madison's Motor Equipment Division and the State Department of Revenue's Word Processing Unit knew their customers and employees were unhappy, and line supervisors were caught in the middle. Motor Equipment's customers complained about having to wait weeks or months for repairs. In the word processing unit, the operators and supervisors had endured years of complaints from all of their customers. The supervisor was involved in daily "fire-fighting" as she sought to smooth out problems created by long turnaround times.
Both of these project teams selected manageable projects. Neither team attempted to tackle diffuse or broad problems. They correctly viewed projects such as "communication" or "worker morale" as too complex and abstract, and as symptoms of other, more direct causes. They avoided taking aim at only small pieces of the larger problems, such as equipment shortages or grammatical errors.Furthermore, both downtime and turnaround time are easily measured processes that are responsive to change. The records kept by the Motor Equipment mechanics and the operators in the Department of Revenue helped these employees to isolate problems by comparing lapsed time for the steps in their processes. Their data also allowed them to strike at the real causes of problems. Having eliminated the causes, they could take steps to prevent future problems, thereby improving the process as a whole.
The composition of these teams also contributed to their success. Terry Holmes, the president of the local labor union, was crucial in motivating the Motor Equipment mechanics, assuaging their fears, anticipating potentially troublesome situations, and taking steps to resolve them ahead of time. The word processing team was a mix of line workers and supervisors involved daily in the process being studied and of customers, resulting in a rich flow of useful information the Bureau had never before had available.
Another factor was the knowledge, commitment, and involvement of these agencies' top managements. Revenue's Secretary Michael Ley, Deputy Secretary Eileen Mershart, and Madison's Mayor, F. Joseph Sensenbrenner have all made extensive efforts to educate themselves and others in the new philosophy and its tools and techniques. They have communicated their commitment in word and action, and are seeking to create an organizational atmosphere free of the fear of failure. Once the Department of Revenue's projects had been completed, Secretary Ley held an all-day senior management retreat in order to begin developing a collective vision of what the department should look like in the future. Mayor Sensenbrenner also met with his managers to review a quality improvement implementation plan in December 1985.
These top managers' commitment has encouraged other managers naturally inclined toward this approach to emerge. Lee Cheaney, Revenue's Bureau Director of Inheritance and Excise Taxes, is now leading his bureau using the quality improvement style and methodology. Other departments are beginning to contact Cheaney for help in getting teams started. Madison Police Chief David Couper has always felt comfortable with participative management, and now has a viable framework within which management and project teams can more scientifically do their work. Other departments throughout the city and state are now seeking information and hoping to get involved.
The final important ingredient is guidance by neutral third parties. Skilled at team-building, unencumbered by group power dynamics, the outside facilitators on the Motor Equipment and Department of Revenue teams were also well-versed in quality improvement philosophy, goals and methodology. Through their guidance, teams stayed focused on customers' needs and the causes of problems. Teams let the data do the talking, and they gained valuable education and skills in the process. What of other, less-successful projects? What went wrong? Again some common patterns emerge.
If team members were either unwilling to speak up or inclined to dominate, communication and information flow halted. If customers and other co-workers were neither surveyed nor interviewed, teams found themselves running in circles, unable to focus on root causes and concrete problems because they didn't know what their customers wanted. When teams chose a "fuzzy" issue or abstract process to study, the sheer complexity caused months of wheel spinning.
On the other hand, if teams tackled relatively insignificant projects, they sometimes felt deflated after solving the problem thinking, "You mean it was that simple?" For these teams to reap any benefits, it was important for them to step back periodically and ask, "What do we know now that we didn't know before?" Otherwise frustration, conflict and boredom could set in.
Basic Guidelines
How do the examples described above fit within the larger context of quality improvement strategies? The processes studied and improved involved front-line workers. Higher-level processes such as preparing budgets and making policy can also be studied and improved. Teams in such instances will be composed of senior managers.
A key step toward quality and productivity improvement is to open all lines of communication: between managers and employees, between an agency and the people who use its services and whose services it uses, between the various units in an agency. The result will be a flow of ideas and creativity, tapping into human resources that will allow agencies to improve services without having to increase the flow of financial resources.
"Looks good on paper," one might be thinking, "But I can't just open up those floodgates. How could I handle all those ideas?" The traditional structure of organizations leaves people ill-equipped to deal with this creativity. As seen in the above examples, employees had to be given new tools and a new framework in which to act. The most powerful tools are scientific methods, the most effective of which are easy to learn. Statistical methods, for example, allow people to learn from data: how to collect data most efficiently and how to extract useful information from data once it had been collected.
Yet statistics and other scientific tools are no panacea. Their power can remain unrealized in cramped environments. Only when combined with open communication and an obsession with meeting customer needs can these tools be used effectively. Data cannot be gathered without widespread cooperation and teamwork. Top management must take the lead here by creating an open, collaborative climate, otherwise employees may be hesitant to collect data on work they are doing because of the fear that such information will be used against them or their co-workers. They may worry that if gains in productivity are realized as a result of such activity, some of them may lose their jobs.
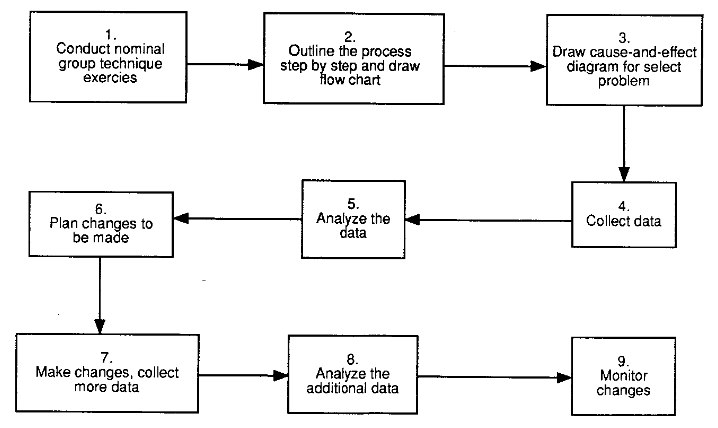
Figure 8. Guideline for getting started: a suggested sequence of nine steps.
Consequently, management methods in most organizations must be drastically overhauled to change the atmosphere from one of fear to one of trust. The idea of collecting data is not to blame and criticize individuals but rather to improve all processes and systems within the organization.
When top management removes barriers, employees at all levels will be encouraged to learn techniques for effective use of technical and human resources. This re-education process-developing a united team, a scientific approach to problem-solving, and unrelenting focus on customer and quality-is hard work.
As Madison's leaders are discovering, a large portion of the learning comes by doing. Their projects can serve as models for projects elsewhere. To help other public administrators get started, we offer the following guidelines in nine steps that represent the best features of the projects we've observed (see Figure 8). This nine-step sequence need not be followed in a lock-step fashion. Depending on circumstances, some modifications may be desirable.
| Step 1: Conduct a Nominal Group Technique exercise | These sessions are structured meetings that are extremely useful at the outset of a quality improvement project. The format allows teams to identify, through a voting process, a vital few problems needing attention. |
| Step 2: Outline the process step by step and draw flow chart. | Flow charts are one of the simplest and most effective [[quality tools]] to use because they allow teams to understand the process on which they are working and to pinpoint where problems are occurring. |
| Step 3: Draw a cause-and effect diagram for selected problem. | Like flow charts, cause-and-effect diagrams are powerful yet simple tools. They enable teams to focus on possible causes of problems. (Once a problem is isolated through the flow chart, a cause-and-effect-diagram helps identify the exact kind of information that needs to be collected.) |
| Step 4: Collect Data | If the team has followed the above steps, it should have some idea of where problems are occurring and what kinds of data are needed to find the actual causes of problems. |
| Step 5: Analyze the data. | Analyzing data also varies according to specific situations. Most often, however, simple techniques can reveal patterns in the data and point the way towards solutions. Pareto charts, bar charts, dot diagrams and trend plots are particularly useful. |
| Step 6: Plan the changes. | What skills or resources are needed to make the changes indicated as necessary by the data? Who will do the training? By what steps will the changes be introduced into the old system? |
| Step 7: Make changes, collect data. | Carry through with planned changes while continuing to collect data. This way the team will be able to access the effectiveness of the changes. |
| Step 8: Analyze the additional data. | Analyze the data on the altered process. Did the changes help? If the changes did not help, try to find out why. Go back to flow chart and cause-and effect diagrams. Was the process assessed correctly in the first place? Are there factors left out of initial considerations? Decide on a course of action and begin again at an earlier step. |
| Step 9: Monitor changes. | Did further changes the team make have desired effects? Did problems arise on a broader scale when changes were implemented? Did other aspects of the problem surface? This analysis should point out how the process can be improved further. Since quality improvement is a never-ending process, the team will probably pick up the loop again at an earlier stage. How far back it goes will depend on how different subsequent problems are from the original one. The team may need to draw up new flow charts and cause-and-effect diagrams. |
Keep in mind the philosophy behind the entire process of quality improvement. Concentrate on these principles:
- the purpose of the quality improvement is to meet and, if possible, exceed the needs and expectations of customers;
- a focus on quality as defined by the customers will result in increasing productivity and decreasing costs;
- keep the communication lines open in all directions-customers, suppliers and employees are all valuable sources of ideas and suggestions;
- at most, 15% of the problems in any process are within a worker's control. The other 85% or more are system problems that only management has the power to correct;
- a long-range collective vision for where an organization is going is vital to the success of any quality improvement effort. Develop this vision with the help of managers at all levels. Begin working in management teams to articulate this vision;
- think of quality improvement as a never-ending continuous process. Be forever obsessed with quality in order to keep improving;
- and learn gradually by doing. Build your confidence.
Finally, remember that the core of quality improvement is utilizing human resources. American managers have tended to ignore them for too long, and they may not know where to begin. Our suggestion is to add the following four sentences to all job descriptions:
- always be asking, "How can we make things better around here?"
- ask, "How can we serve our customers better?"
- ask, "What hassles, frustrations and inefficiencies prevent me from doing my job as well as 1 would like?"
- share the answers with colleagues, managers, suppliers and, as appropriate, customers.
The public administrators who are attempting to implement this new management philosophy in Madison are pioneers. Although this management style is firmly entrenched in many Japanese businesses, it has rarely been used in any Japanese public sector organizations. As far as we know, no other American government organizations are attempting to implement this approach in its entirety (although we'd be glad to be corrected on this point). Learning by doing takes time, patience and courage-especially when there are few models to emulate.
Unfortunately, there are special problems inherent in the public sector. Long-term planning is extremely difficult to do. With one eye on re-election or appointment every two to four years, top management is faced with transforming an entire organization in an impossibly short time. The public may be quick to criticize when changes are slow, and public officials are often hesitant to take the necessary risks. Civil servants who enjoy long-term employment, however, may be able to keep quality improvement alive. There is the potential in this group for building what W. Edwards Deming calls "constancy of purpose" (Deming, 1986).
It takes courage for public leaders to commit themselves and their organizations to this approach. As one Japanese executive remarked, however, "You cannot afford to be faint-hearted about improving quality."
Once upon a time in a tropical country, several people lounged under a bright, hot sun. Some swam in a nearby pool. A young man who happened by was entranced by what he saw. He had never been swimming, but it looked enticingly refreshing. After a few captivating minutes, the young man resolved to give this thing a try. He must have thought it looked so easy. After all, these people just moved their arms and legs about in simple patterns.
Confident he knew what to do, the young man ran straight to the pool, jumped in ... and sank ten feet to the bottom. Fortunately, a woman had seen what happened. She dove in and hauled him out of the pool, where he was revived.
Like this young man, many of us hear about innovative management practices and think to ourselves, "How easy it all looks." We jump in without proper guidance and wonder where we went wrong as we sink to the bottom of the deep end.
There is much more to both swimming and quality improvement than meets the eye. The "visible pieces" are only part of the story. Some people reading about Madison's quality improvement projects may say, "It's really nothing new." They will look at their own practices or employee participation programs and think they have all the tools and methods they need; they've just never combined elements in the ways we've discussed. They're ready to imitate the success of others, envisioning quick and glorious results.
Unfortunately, they are as mistaken as the young man at the swimming pool. Quality improvement, like staying afloat, can become second nature, but it also takes education, patience and practice before you can do it on your own. For quality improvement, a sweeping overhaul of attitudes and approaches is needed. Also required are commitment, energy, perseverance and creativity. In mastering this transformation, America may again be able to proclaim advances in management. Public administrators who, to an even greater degree than their private sector counterparts, are frustrated by having to do more with less can take the lead.
The references at the end of this article provide further details for readers who want to learn more. We would enjoy hearing from anyone about their successes and failures in shifting to this new style of management.
As a final note, what do the managers and workers have to say about the time and energy they have invested in these efforts? In Madison, one supervisor said about labor-management relations in his division: "It used to be us against them. Now it's just us." In turn, Joe Turner, a division foreman, observed, "Now there's less cussin' and more discussin'." Quality improvement can work in the public sector.
Acknowledgments We are grateful for financial support that was provided for this work by the First Wisconsin National Bank, Wisconsin Power & Light Company, City of Madison Economic Development Commission, Mayor's Civic Improvement Fund, and the National Science Foundation through Grant Number DMS-8420968. Assistance provided by the University-Industry Research Program of the University of Wisconsin-Madison is also gratefully acknowledged.
We would like to thank the City of Madison's and the State Department of Revenue's managers and employees who had the courage to risk, get involved and stay committed to continuous never-ending improvement of their "services. Specifically, we are grateful to Mayor F. Joseph Sensenbrenner, Secretary Michael Ley, Deputy Secretary Eileen Mershart, Lee Cheaney, Jerry Pionkowzki, Jerry Franklin, Terry Holmes, and Joe Turner. In addition, we would like to thank Peter Scholtes and David Miller, without whose energy, enthusiasm and insight these efforts in the public sector would not have begun. Finally, our eternal gratitude to Sue Reynard, editor and advisor extraordinaire.
Nuts and Bolts References
- Box, George E.P., William G. Hunter, and J. Stuart Hunter. Statistics for Experimenters. John Wiley & Sons; New York, 1978.
- Delbecq, A., A. Van de Ven, D. Gustafson. Group Techniques/or Program Planning-A Guide to Nominal Group and Delphi Processes. Scott Foresman, Inc.; Chicago, 1975.
- Fuller, F. Timothy. "Eliminating Complexity from Work: Improving Productivity by Enhancing Quality," National Productivity Review. Autumn 1985. p. 327-344.
- Grant, Eugene L. Statistical Quality Control. McGraw-Hill, Inc.; New York, 1972.
- Ishikawa, Kaoru (translated by Asian Productivity Organization). Guide to Quality Control, Nordica International Limited; Hong Kong, 1982.
- Juran, Joseph M. (editor-in-chief). Quality Control Handbook, 3rd ed. McGraw-Hill, Inc.; New York, 1951.
- Ryan, Barbara F., Brian L. Joiner, and Thomas A. Ryan, Jr. Minitab Handbook, 2nd ed. Duxbury Press; Boston, 1985.
- Western Electric (now AT&T). Statistical Quality Control Handbook. Mack Printing Company; Easton, PA, 1956.
Management References
- Chandler, Alfred D., Jr. The Visible Hand: The Managerial Revolution in American Business. Belknap Press of the Harvard University Press; Cambridge, MA, 1977.
- Deming, W. Edwards. Out of the Crisis. MIT Press; Cambridge, MA., 1986.
- Hunter, William G. "Managing Our Way to Economic Success: Two Untapped Resources," Report No. 4, Center for Quality and Productivity Improvement; University of Wisconsin-Madison, 1986.
- Ishikawa, Kaoru (translated by David J. Lu). What is Total Quality Control?: The Japanese Way. Premice-Hall, Inc.; Englewood Cliffs, NJ, 1985.
- Joiner, Brian L. and Peter Scholtes. "Total Quality Leadership vs. Management by Control," Report No. 6, Center for Quality and Productivity Improvement; University of Wisconsin-Madison, 1986.
- Juran, Joseph M. Managerial Breakthrough. McGraw-Hill, Inc.; New York, 1964.
- Sheehy, Barry. "A Near-Run Thing: An Inside Look at a Public Sector Productivity Program," National Productivity Review, Spring, 1985. pp. 139-145.
- Scholtes, Peter. "How American Management Got to Where It Is," report in preparation [never finished]
This work was sponsored in part by the National Science Foundation Grant DMS-8420968 and First Wisconsin National Bank, Wisconsin Power & Light Company, City of Madison Economic Development Commission, and the Mayor's Civic Improvement Fund. Assistance provided by the University-Industry Research Program is also gratefully acknowledged.
Copyright © 1986 by William Hunter, Jan O'Neill and Carol Wallen