williamghunter.net > George Box Articles > Integration of Techniques in Process Development
Integration of Techniques in Process Development
George Box
Copyright © 1991 by George E. P. Box. Used by permission.
Practical Significance
The teaching of statistics, its presentation in text books, the analysis and reanalysis of data sets, certain aspects of significance tests and most recently the writing of G. Taguchi encourage the idea that statistical methods are applied in a "one-shot" investigational environment.
By contrast any examination of the way in which engineering studies and scientific investigations are actually carried out shows that an iterative procedure is usually employed. This paper explores the reasons why such a procedure is necessary. It is believed that one reason that statistics is only grudgingly accepted by many engineers and other scientific experimenters is that the implied one-shot approach takes away the flexibility which intuitively they know to be essential.
Author's Note: Recently, there has been renewed interest in the philosophy of investigation and in particular in its essentially iterative/sequential/adaptive nature. The iterative rather than the "one-shot" concept for experimentation has profound implications for the way we approach statistical inference, the use of data analysis, and experimental design. With this in mind it seems appropriate to make the following article more generally available. The paper originally appeared over thirty years ago in the transactions of the 11th Annual Convention of the American Society for Quality Control.
Introduction
Quite different problems confront the experimenter at the various stages of development of a process investigation and quite different techniques are appropriate to solve them. As the last speaker in this discussion on the strategy of experimentations it seems appropriate for me to discuss the roles which various statistical methods can play in helping process development along and to try to see how these various techniques fit together.
It is perhaps unnecessary to say that I do not believe in the present existence or possible future existence of any particular statistical procedure which would be best in all circumstances. The current situation in statistics is not that there are a variety of techniques in competition to fill some narrow area of endeavor. Rather the field of interest might be likened to a large unfinished painting. Some outlines have been sketched and a few areas have been painted in but major portions of the canvas are quite blank. We have to recognize where these blank spaces are and to think how they should be filled. Certainly it will do no good to pretend that the painting is really complete, or that none of the parts which have been painted in should ever be retouched, or that all the blank spaces can be adequately filled merely by repeating a pattern which has been used successfully somewhere else.
1.1 Indeterminacy of experimentation
Someone once said that the only time that an experiment can be properly planned is after it has been completed. The more one contemplates this paradox the more one is convinced of its essential truth. Consider, for example, an investigation involving continuous variables like time, temperature, pressure, etc., when the true underlying relationships (represented by the response surface) between the response and the variables is not known. This experimental situation, like most others, is beset by a bewildering number of indeterminacies which exist whether any statistical methods are used or not.
Which variables should be studied? In a given situation one experimenter might regard one set of variables as important and another might include different variables.
By how much should the variables be changed? One experimenter might, for instance, regard a ten degree change in temperature in a particular context as a large change, while another might think that it was quite small.
In what form should the variables be considered? Should we think in terms of time and temperature or of log time and reciprocal absolute temperature? Or maybe we should not think in terms of these two variables at all but rather in terms of some single function of them.
How complex a model (and hence how elaborate an arrangement of experiments) is necessary in a particular situation? For instance, in a given context the approximation that locally the response surface was planar might be sufficiently close to allow progress to be made using a simple arrangement of experiments based on this approximation. In other contexts the approximation and the corresponding experimental arrangement would be quite inadequate.
We see that in an investigation of this kind we are expected to explore the behavior of a function of unknown complexity within a space which is not even defined. Seemingly a difficult assignment!
1.2 "You choose the strategy, I will choose the surface."
If more is needed to see how hopeless our tasks appears, let us play a game in which you decide the strategy for exploring an unknown response surface and I, acting in the capacity of "devil's advocate", decide the surface.
| If you choose: | I will choose: |
| one factor at a time | a surface with large interactions |
| steepest ascent | a surface with many bumps |
| fractional factorial designs | a surface with large 3-factor internerions |
| second order fit | an exponential type response |
| grid mapping | a flat plane with a single point sticking out from the surface. |
Although, for illustration, we have confined attention to one particular kind of investigation, indeterminacies which are just as puzzling seem to occur in other situations. One might feel justified in concluding that scientific investigation must be an unrewarding pastime and success a matter of purest luck. We are faced, however, with the embarrassing fact of the phenomenal success of the experimental method over the last three hundred years or so. Perhaps we are not thinking about things the right way. Let us consider the experimental method itself for a moment.
2. The Iterative Nature of Experimentation
It is well known that a recurrent theme is found in almost all scientific investigation. This is the successive interplay of the two complementary processes which we shall call processes d and a. The first process, d, is concerned with the movement from conjecture to experiment and the second process, a, with the movement from experiment to conjecture. These complementary processes are used in alternation many times during an investigation. By theft repeated employment, the experimenter's knowledge of the system studied becomes steadily greater in the manner illustrated in Figure 1.
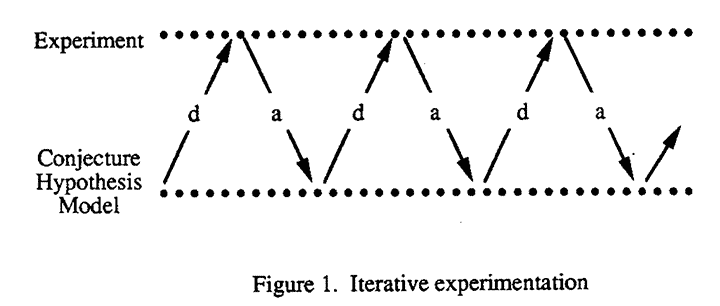
More specifically:
- process d is concerned with the devising of experiments suggested by the investigator's appreciation of the situation to date and calculated to elucidate it further;
- process a is concerned with examination of the results of experiments in the light of all the background knowledge available.
To put it in still another way:
- process d is concerned with analysis of hypothesis and synthesis of a suitable experiment
- process a is concerned with analysis of the experiment and synthesis of a new hypothesis or hypotheses.
In a statistical context it is customary to relate these processes to the experiment rather than the hypothesis, so that process a is associated with what is called the statistical design of the experiment and process a with the statistical analysis. In this paper the words "design" and "analysis" have been avoided until now for, as will be seen from the definitions above and the examples which follow, they are intended to include other things besides the purely statistical concepts usually associated with these labels. With this proviso then, the process we are considering is typified by the successive and repeated use of the sequence:
Conjecture: Design: Experiment: Analysis
The iterative situation described above is very different from that implied by certain common usages of statistical methods. For instance, "significance testing" as sometimes practiced seems to imply that some irrevocable decision is to be made immediately following the first experiment, no further observations being allowable, and that some dreadful misfortune will befall the experimenter if he errs by drawing a conclusion which is not sufficiently conservative, although no penalty will result if he falls into the error of being too conservative. I do not deny that such a situation might occur but I do believe it is unusual.
2.1 An example of classical iterative experimentation
To focus attention on this process of experimental iteration let us consider an example where statistical methods are not involved. We will try to understand the actions and reasoning of some experimenter engaged in speculative research whose object is to prepare a certain chemical C by a mute not previously investigated. At the start we suppose he has some, perhaps not very precise, ideas as to the general way that chemical C might be prepared. The iterative sequence would then begin and the thoughts of the experimenter might follow a pattern somewhat like this:
| Conjecture: | "I believe that in suitable circumstances reactant A would combine with reactant B to form the desired product C." |
| Design: | "From theoretical knowledge, my own experience, and other people's experience of similar reactions cited in the literature, I should think that certain conditions X (defining proportions of A and B, temperature, time, etc.) might be worth trying." |
| Experiment: | The appropriate experiment would then be performed, and this would include a chemical analysis of the product. |
| Analysis: | "After studying the appearance and physical nature of the product and the numerical results, it appears that a little of the desired product C was produced but that a high proportion of unwanted product D was also present." |
A single cycle of the sequence has now been completed but the last phase of analysis immediately leads to a new conjecture and the beginning of a new cycle:
| Conjecture: | "The presence of such a high proportion of unwanted product D could be due to the large amount of water used to dissolve the reactants, which might favor the formation of D." |
| Design: | "I will perform the experiment in the same way as before, but this time I will use a non-aqueous solvent Z instead of water." |
He is thus led to perform a further experiment. In this general way his investigation continues.
In some cases this process would be brought to an early stop. Some overriding difficulty might be encountered, such as the presence of an embarrassing impurity, which would lead the experimenter to abandon this particular route of manufacture. Eventually, however, he would often be led by this method to a mode or modes of chemical preparation which, in the laboratory at least, were satisfactory.
We see that the scientific method is not, and can never be made, an exact procedure. In particular it is not like an exact method for the calculation of the root of some mathematical equation in which an answer is reached by a unique sequence of steps in calculation. Rather it is an iterative process analogous to the iterative "relaxation" methods of numerical analysis in which faltering (and in the light of subsequent knowledge perhaps even ill advised) steps are made at the beginning of the process. Because the situation is set up so that the investigator has an opportunity to learn as he goes along, however, he can hope to be led along one path to the solution. The path actually followed will differ from one experimenter to another and its length will depend very much on the ability of the person concerned. The objective of the statistician in trying to help the experimenter should be not to try to make the path he follows unique but to supply him with techniques which will help to make the process he follows converge to the correct solution as rapidly as possible.
3. Three Important Phases of Experimentation
We shall discuss in a moment how the iterative experimental process may proceed in investigations in which statistical techniques are employed; before we do this we consider what sorts of information we might be seeking in such investigations.
To avoid confusing the essential issues, let us begin once more by considering a problem where statistical considerations are not essentially involved.
Suppose we were for the first time studying the distance s fallen by a solid body in a vacuum. Initially one might postulate that s could depend on the levels of a number of variables t, u, v, etc. The variable t might represent the time of falling, the variable u the weight of the body, the variable y the volume of the body and so on.
Thus we conceive a possible functional relationship between the response s and the "variables" t, u, y etc.
Three distinct stages can be considered in the investigation of such a relationship:
- (i) Study aimed at deciding which variables affect the response. In this example it would be found that (to the degree of exactness here considered) s depended only on t.
- (ii) Empirical study of how the variables affected the response. In this example experiments would enable us to plot a graph showing the relationship between s and t over a certain range of t. We might present this information either in the form of the graph itself or in the handier form obtained by describing the graph by the equation of some simple curve (e.g. an interpolation polynomial) which graduated it in the region concerned. Such an equation would, of course, make no claim to have any basic meaning and would usually be inapplicable outside the region actually investigated.
- (iii) Theoretical study which resulted in an equation derived from a postulated mechanism for the phenomenon studied. This might explain more or less adequately why the response was affected by the variables in the manner observed. In the present example Newton's gravitational theory leading to the formula
 would provide such a theoretical equation.
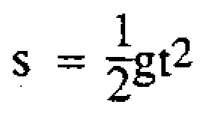
We are thus able to distinguish three component phases of investigation, each of which can involve the use of appropriate statistical methods. These are:
- (i)Screening studies aimed at delineating the important variables.
- (ii) Empirical studies aimed at describing certain important features of the relationship between the response and the variables (e.g. the "effects" of the variables in some particular region, or more ambitiously the principal features of the multidimensional graph or "response surface" relating the response and the variables in some important region of the variables).
- (iii) Theoretical studies aimed at discovering plausible mechanisms for the phenomena studied and estimating, to satisfactory accuracy, the relevant parameters.
All these phases usually involve the same iterative sequence - conjecture, design, experiment, analysis, so that in terms of complexity, although not necessarily of order in time, the route followed resembles Figure 2.
This route should be likened to an unlimited access highway. Few individual investigators do or should proceed from one end of it to the other in any particular study. In some cases an experimenter is concerned only with delineating important variables; he enters at A and leaves at B. In some cases the important variables may have been derived already (or it may be claimed that they are known) and the process begins at B and perhaps ends at C, or it may go on to D. Or having begun at B it may be necessary to go back to A because it may become clear that the important variables are not known. In differing contexts all points of entry and exit are possible and relevant; "retracing steps" and "doubling back" will frequently occur and the phases we have distinguished may be less distinct. It can be argued that a fourth important phase is the transition from (ii) to (iii). As has been illustrated, for example (1), by careful consideration of the results of an empirical study, ideas tending to the development of a theoretical model can develop. We here regard this important process as part of phase (iii).
We shall now briefly survey these various phases of study in the light of the iterative situation we have mentioned and consider what is known of statistical procedures which are appropriate to assist their progress.
4. Screening Experiments
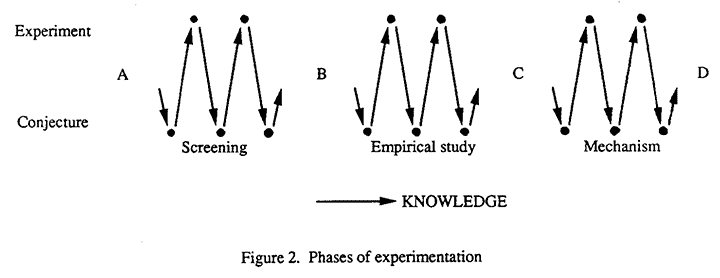
In the study of the distance s fallen by a solid body in vacua in time t, we needed to discover that the variables u, v, etc. were not affecting s and need not be considered. The situation is illustrated geometrically in Figure 3.
All the change in s is occurring in the direction of the coordinate axis t. No change is occurring in the direction which represents u, v etc. We can fix the value of u, v etc. at any values we like (corresponding to taking a section through the model at some point parallel to the axis of t for any values of u and v) and the graph of s against t is unchanged.
Clearly the problem at the screening stage of an investigation is that of probing the space to find those directions in which redundancy occurs. In this example, where experimental error is of no importance, it would be a simple matter to devise experiments which would do this at least superficially. Also, for systems as clear cut as this, various devices such as dimensional analysis might be employed to help the process along.
Suppose, however, we are confronted with a situation where:
- (i) very little theoretical knowledge of the system was available;
- (ii) experimental error was large;
- (iii) although there was a large number of variables which it was felt might affect the response (perhaps 10 or even more) it was felt unlikely that more than a few of these (perhaps three of less) would be of any real importance;
- (iv) only a limited experimental effort could be justified;
- (v) there was no overriding necessity to keep the experimental program simple, and consequently large numbers of variables could be altered simultaneously in the same group of experiments.
Two procedures are known to me, which in some cases at least would seem to be aimed at the solution of this problem. The first usually utilizes fractional factorial designs and the second the random balance designs proposed by Satterthwaite. The details of the latter procedure have yet to be published so I will concentrate on the first.
Bearing in mind characteristics (ii) and (iv) and (v) of the screening situation, it seems we must use a design which, for a given total number of observations, will give maximum possible accuracy for the estimation of the effects of the variables. It is known that this property is enjoyed by designs for which all the variables are included simultaneously and for which there is a high degree of symmetry in the space of the variables. It is enjoyed, in particular, by factorial designs and fractional factorials where the high precision attained may be thought of as arising from so called "hidden replication". For large numbers of variables it will in general be true that complex relationships which involve all the variables cannot be elucidated without a large number of experiments. For example, where the function can be represented by a polynomial in which terms of order higher than d are omitted, the series will contain (k + d)! / (k)!(d)! constants and we should require at least this number of observations to estimate all of them.
We might proceed, however, by using designs which, although insufficient to estimate separately all the constants if the whole group of ten variables were important, would nevertheless be adequate to estimate all the constants of say first and second order[a href="#*"]*[/a] associated with any particular small group of variables if the remaining variables were unimportant.
[a name="*"]*[footnote][/a] We can of course easily imagine functions which are far too complex to be represented by anything so simple as an equation of second degree even locally but provision (4) above forces us to take risks.
Now although the two-level fractional factorials do not completely satisfy this criterion, since estimates of "quadratic effects" are always confounded with each other and with estimates of the mean so that we may wrongly tag as redundant a variable which happens to be passing through a maximum and which does not interact with any other variable; yet this contingency is remote and the designs are in fact of considerable value for the purpose in hand. Their value is still further increased by the addition of center points. By this means the designs are made to supply at least an "overall" measure of curvature and some rough indications of experimental error.
With fractional factorials, or indeed with any design that can be devised, ambiguities of interpretation can arise. However, usually we will have fairly wide choice of the particular fractional design to be employed and it will be possible so to arrange matters that estimates of main effects and interactions are not associated with other estimates thought to be of importance. The designs also have the great advantage emphasized by Davies and Hay (2) and Daniel (3) that a first fraction can be a "block" in any one of a set of larger fractions, the choice of the second fraction being decided from the results of the first. For a screening investigation employing fractional factorials therefore the iterative process proceeds somewhat along the following lines:
| Conjecture: | Only three out of ten variables are likely to have appreciable effects. |
| Design: | Use fractional factorial avoiding aliasing main effects with two factor interactions which seem likely to be important and with a view to the possibility of making this design part of a more extensive fractional factorial. Include center points. |
| Experiment: | Perform appropriate design in random order. |
| Analysis: | Some method of indicating plausibility of various possible explanations of data (such as Cuthbert Daniel's half-normal plot (3)). Explanations based on (i) simple redundancy (ii) redundancy after transformation (iii) redundancy after transformation and/or omission of wild observations, particularly considered. General inspection which might suggest ideas not originally in mind of great importance. |
| Conjecture: | Based on those explanations of the data and on those new ideas which were judged "important". |
| Design: | Arranged so that rival plausible conjectures could be separated and "important" explanations further confirmed. |
Some remarks on this process may be made. The function of analysis in the scientific process is to facilitate consideration of the data in the light of all possible explanations of it. We shall in this particular stage of experimentation have special interest in detecting which of the variables are redundant. We, however, should not allow this primary condition to impede proper inspection of the data from any other viewpoints that might suggest themselves. The question of redundancy itself must be broadly viewed. As Daniel has emphasized, a fuzzy picture can often be brought into sharper focus by a suitable transformation of the data or by omitting certain of the observations which may have been in error. His "half-normal plot" analysis provides a valuable way of surveying the possibilities.
Other methods might be employed. For example, an electronic computer might be programmed to calculate values of likelihood or "significance" associated with a very wide range of possibilities (for the problem discussed it might calculate some measure of plausibility for the ten 9-variable redundancies, the forty-five 8-variable redundancies, the one hundred and twenty 7-variable redundancies etc. and the same for various transformations and for different possible omissions of observations). It might then retain for report all of those having more than a given degree of plausibility.
The question of whether the hypotheses considered in the analysis were in mind when the experiment was planned is of course quite irrelevant in the present context. It is never true that we are barred from deducing new hypotheses from the data for test in later experimentation. If that were so no progress would be possible.
In judging the importance of possible explanations of the data the measure of plausibility is one of the things which must be considered. However, at least two other elements must also be taken into account in the planning of further action. First, the experimenter must consider whether the effects observed do or do not agree with what he feels to be reasonable. If a hypothesis which seemed contrary to all reason were thrown up as likely the experimenter would rightly require further evidence before he believed it.
Second, the experimenter must consider the observed effect in relation to its possible utility. If the reality of an effect is in no real doubt but its direction is such that it can be of little value, it will receive less attention than a less plausible effect of potentially higher utility.
4.1 Comments on the formulation of the screening problem
Two comments are appropriate concerning the general formulation of the screening problem:
First, it should be noted that the problem, as stated, is concerned with the detection of redundancy of rather a special kind - namely redundancy of the variables when they are considered in the particular manner defined by the experimenter. In practice where there are say ten variables which may affect the response we may well find that perhaps half or more of them are redundant in this sense. It will probably turn out however that redundancy of different kinds will occur among the remaining variables.
For example, in a problem in which the response "yield" depended only on the ratio of two concentrations the particular decision to consider the separate concentrations as variables, and not for example to consider "ratio of concentrations" as one variable and "overall concentration" as the other, would mean that no redundancy would be found. To quote a second example, it might be that in a cake-mix only one variable, the acidity of the mix, was really affecting a certain response. If this were so, all variables which affected acidity would be found to have effects, although by making suitable transformations of the variables these effects could be reduced to that of a single variable.
Geometrically, this means that we are searching the space for redundancy only in those directions parallel to rather arbitrary coordinate axes.
A second point which should be noted is that the appropriateness of the solution given is dependent on the applicability of the assumptions (i) that only a limited experimental effort can be justified and (ii) that a rather complex experimental program can be run.
There are certainly very many practical situations where these assumptions apply, but there are other situations where, provided the experimental designs employed are simple and do not involve too many of the variables simultaneously, a continuous program of small varieties of process conditions may be installed as part of the normal production routine. This method of "Evolutionary Operation" has been described in (4).
5. Empirical Surface Study
The problem at this stage of experimentation is frequently to find optimum process conditions and to describe the behavior of the response function in the optimal region. The latter part of this sentence is emphasized because knowledge of the position of a single optimum point is seldom satisfactory. This is because (i) knowledge of the local behavior of the function is essential to allow intelligent operation and control of the process, (ii) to allow recalculation of optimum conditions when external features, such as prices of raw materials change, we must know the local behavior of the response function near the provisional optimum, (iii) usually the problem involves not one single response but several responses (cost, purity, color of product, physical form of product etc.). To arrive at a satisfactory compromise it is essential to know the local behavior of all the response functions in the optimal region.
To allow progress to be made in this problem, iterations of different kinds occur simultaneously.
5.1 Iteration in position
The results from a group of experiments may be employed to tell us where a further group of experiments should be performed, so that the second group is closer to optimum conditions than the first, or so that it straddles the region of interest more satisfactorily. This is essentially a process of iterating in the position of the experiment in the space of the variables. Examples of experimental procedure which do this are the one factor at a time method, the method of steepest ascent and methods of surface study which employ canonical analysis of fitted second degree equations. The reader will have no difficulty in distinguishing the components, "conjecture", "design", "experiment", "analysis" in such procedures. It will be noted that in practice "steepest ascent" and "canonical analysis" are both examples of dynamic processes of analysis leading to formulation of new experiments.
5.2 Iteration of scales, metrics and transformations
Not only must we iterate on the position at which observations are made in the space of the variables but simultaneously on the way in which we choose to consider that space. Thus initially the experimenter might propose a two-Level factorial experiment in which temperature was changed by fifteen degrees and time by three hours, thus implying that at this stage of the investigation at least he regarded these changes as in some way comparable (and consequently that if the response surface were visualized it ought at this stage at least to be visualized so that differences of these magnitudes were represented by equal distances in the space). Results of the first group of experiments might however very well suggest either or both of these scales had been poorly chosen and that they should be made wider or narrower in the next group of experiments.
Again, a group of results might suggest that the metric associated with a given variable was capable of improvement. This is to say they might suggest it would be possible to represent changes associated with that variable more simply and more accurately in terms of some transformed quantity such as its logarithm or reciprocal. It is in fact possible to set out designs which facilitate the discovery of the most adequate metric. As a general rule we would wish to avoid becoming involved in an elaborate form of equation where a simple form would be adequate with modified metrics. If possible, for example, we would try to use a first degree equation with modified metrics rather than a second degree equation. Similarly, we would try to avoid the necessity for cubic equations where second degree equations with modified metrics would suffice. The problem of how to design the experiments and to carry out analysis so as to be led to the most useful metrics is one which is under current study.
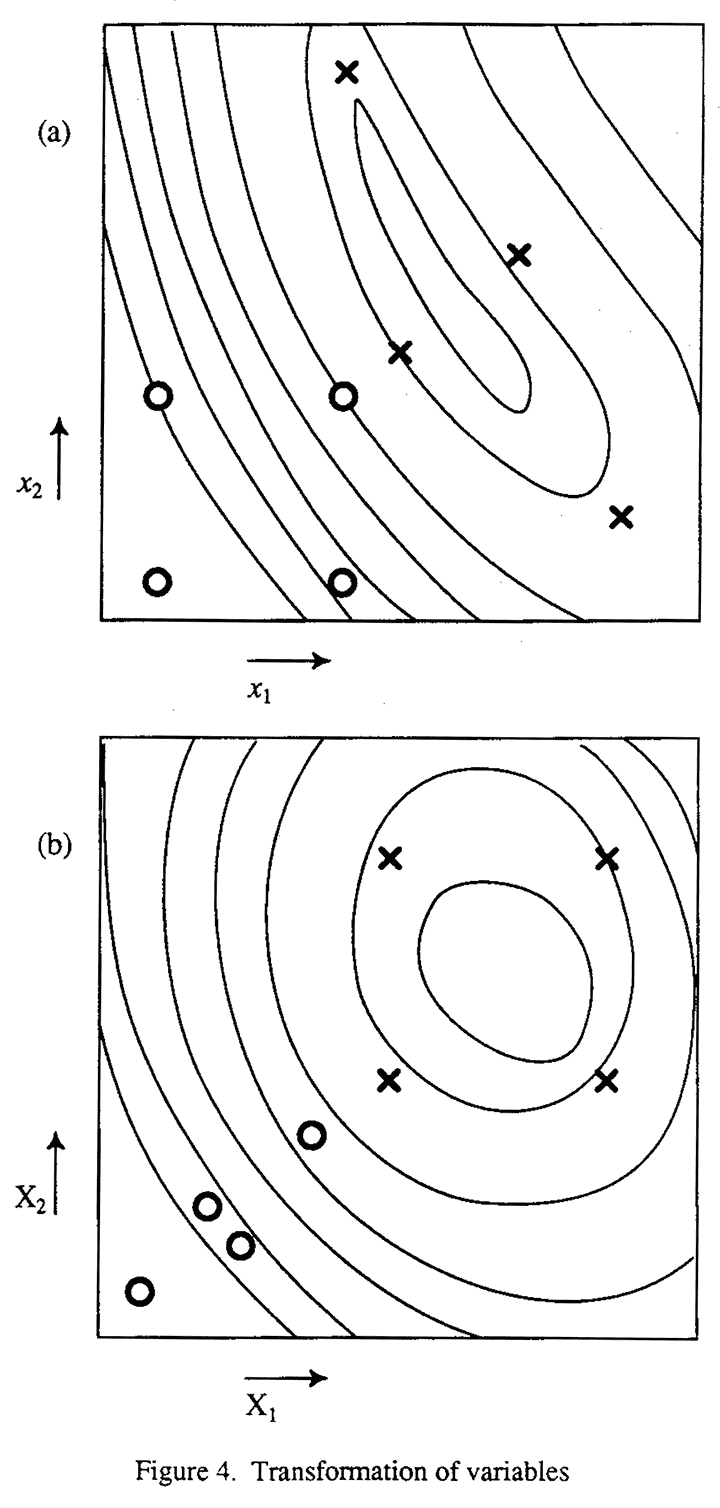
Finally, there is the choice of transformation of the variables where these transformations involve more than one variable. It is frequently the case that the response is not most simply expressed in terms of the natural variables such as time, temperature, concentration but in some compound function of them. In the neighborhood of a maximum the redundancy among the variables studied is usually evidenced by the existence of ridges in the response surface. Study of the response function (for example by canonical analysis) often leads to re-metricization of the problem in terms of a few new variables which are compound functions of the more numerous old variables.
Thus initially we might be working in terms of variables x1 and x2 in terms for which the response surface might be a ridge maximum like that shown in Figure 4a. A 22 factorial in this space would be represented by the "square" group of four dots. After a number of iterations in which the metrics were changed and transformations introduced, we might finally end up with a space defined in terms of new variables X1 = f1(x1, x2), X2 = f2(x1, x2), for which the response surface will take on the more symmetrical shape shown in Figure 4b. A 22 factorial in this space is indicated by the crosses. We notice that the "well designed experiment" in the first space becomes a "very poorly designed experiment" in the second space and we see that in fact the concept of "good design" is entirely relative. In any absolute sense an arrangement of experimental points cannot be said to be good except in relation to its power in elucidating the response surface. But since we cannot know what the response surface is like until we have done some experiments we must necessarily follow an iterative procedure in which we try to get a glimpse of the surface and then modify our approach depending upon what we see. It will not be until towards the end of the iteration that we are in fact getting arrangements of points which are ideally situated for the elucidation of the surface. In the same way, any procedure which we use for analyzing the experiments must be based on our best understanding of the situation at the time. Thus, for example, as Dr. Wilson and I (5) emphasized in our original paper, the direction of steepest descent depends on the particular scales, metrics and transformations chosen to describe the space of the variables. At any given stage, the direction of the steepest descent is the best direction of advance in the light of the best information available at the time as to what are the most reasonable scales etc. in which to consider the variables. Like every other process in experimentation it has no absolute validity but is as good as the auxiliary information allows it to be.
5.3 Iteration on the model and the design
Since we usually wish to conserve experiments and to make interpretation as simple as possible, we should begin by making the simplest assumptions we can. At the same time we should choose the experimental arrangement so that a warning will be provided when a more elaborate model (and consequently a more elaborate design) or more replication (hidden or direct) is likely to be needed to make further progress possible. Thus in practice we might begin by performing a simple design such as a two-level factorial or fractional factorial with added center points, replicating this design, adding other fractions, or augmenting to form higher order designs as appeared necessary.
5.4 Relationship between numerical and experimental iteration
It is of interest to notice how closely the iterative experimental procedure we have discussed matches iterative procedures for the solution of linear and non-linear equations (6). If we have to solve a set of non-linear equations such as:
f1(x1, x2) = 0
f2(x1, x2) = 0
and φ(x1, x2)]2 + [f1(x1, x2)]2 + [f2(x1, x2)]2the problem is equivalent to that of finding a minimum of the function φ(x1, x2). The contours of the function φ in the space of x1, x2may then very well look like those shown in Figure 4a and iterative methods for finding the solution of the equation are analogous to the methods of experimentation which we have discussed. In particular the one factor at a time method of experimentation is similar to the Gauss process for the solution of the equations, the experimental method of steepest ascent has its corresponding counterpart in the steepest ascent numerical method of Booth (6) and the experimental method of using a locally fitted second degree equation is analogous to Koshal's method for fitting curves by maximum likelihood, (9).
6. Theoretical Mechanisms
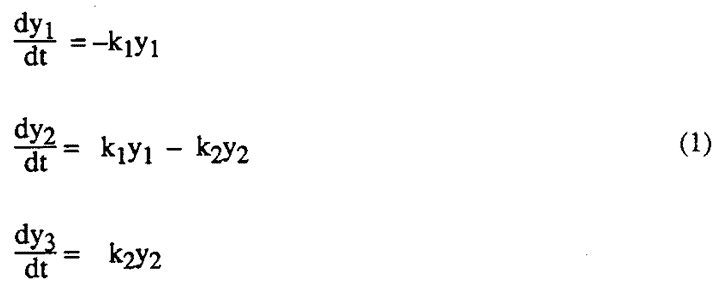
Either after a number of clues have been provided by results of empirical experimentation, such as that described in the last section, or sometimes without such a preliminary investigation, it may be possible for the experimenter to conceive a theoretical mechanism which might describe the phenomena which are being observed. Thus, in chemistry, kinetic theory may provide such a mechanism. From a mathematical analysis of this hypothetical mechanism it will then usually be possible to produce some theoretical functional form which should relate the observations to the variables. Thus consider a simple chemical example in which a reactant A was decomposed to form B which was then subsequently decomposed to form C. With y1, y2 and y3 representing the yields of A, B, and C at time t under certain well-defined assumptions the following set of differential equations represent the system:
In this particular example (although not usually) an explicit solution of the differential equations is available. For example, the yield y2 of the intermediate product B at any given time t is given by
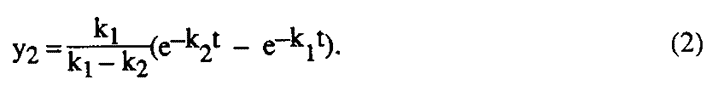
Suppose that the results of a number of experiments are available. In this case, for example, y2 would have been observed at various values of t. The problems then are (i) to discover whether the assumed functional form is adequate to describe the data, and if it is not in what way it is not; (ii) if the functional form does fit the data, to estimate values of the unknown parameters (i.e. the constants k1 and k2 in our example) and to determine their precision as measured by their standard errors and confidence region. Recent work undertaken on this important problem (7,8) has shown that by using the numerical methods it is possible to set up a general program on an electronic computer which will, by an iterative process analogous to the experimental process we have discussed, answer all the questions posed above and, furthermore, that this can be done whether the functional form is given explicitly as in equation (2) above or implicitly as for example by the differential equations (1).
It is found that such a program can be of great value in the formulation of theoretical mechanisms. The experimenter may start off with a theoretical model which he feels is almost certain to be inadequate but which will at least crudely describe the process involved. Analysis of the "residuals", that is to say the discrepancies between the observed and calculated values when the best possible fit has been obtained, then enables him to see in what way his first attempt at a model needs to be modified. With the model suitably altered a second set of calculations will then be carried out on a computer. If this model is again found inadequate the nature of the inadequacy is studied and this again leads to further modification of the model. In this way, finally one or more plausible mechanisms may be found which adequately describe the data already available. It will be realized that such a process need not lead to a correct model but only to a formulation which is descriptive of the data already collected. It is now necessary to set the computer a new task, that of designing experiments which most severely test the model so far postulated. We thus set up an iteration of successive analysis and design which together can lead to convergence on the correct model.
7. Conclusions
What morals, if any, can we draw from this discussion? Some of these are as follows:
- Different situations require different techniques and a major attribute of a good statistician should be to recognize the different situations and to have available the different techniques.
- Much experimentation is iterative and it is the statistician's function to assist this process. The iterative nature of the process must affect his attitude both to design and analysis, and to such specific things as significance tests.
- A strategy of experimentation for continuous variables is only good or bad in relation to the surface which is explored. Thus, as has been so well brought out in the paper by McArthur and Heigl (10), performance on the black box assesses a strategy not in relation to its absolute value but in relation to the surface which is in the box. Because of this the important question we must ask is what sort of surfaces occur in our particular type of work? When we know this we can devise a strategy which will be appropriate. The particular techniques of experimentation which I devised in cooperation with Dr. Wilson and others were themselves very much a product of the iterative process. We tried something and if it seemed to work we kept it and if it did not we rejected it or modified it as seemed appropriate. The emphasis which the second order part of this strategy places on canonical analysis etc. is symptomatic of the fact that the major characteristic of the majority of surfaces which we studied was the existence of ridges or, to express it in a different way, the occurrence of redundancy or partial redundancy not in the variables as studied but in functions of these variables. Such experience as I have had in other areas has led me to believe that this phenomenon may be fairly common. The important thing is clearly to make a study of the types of surface which occur in practice. So far as chemical problems are concerned, this we have tried to do over the past six or seven years in two ways: firstly, by noting the types of surface which have arisen in as far as they can be elucidated by the techniques we have used; and secondly, by studying the characteristics of theoretical surfaces. With the available modem computing equipment with which differential equations can be readily integrated using numerical methods, the elucidation of a wide variety of surface types can be accomplished.
- A point which we have not been able to discuss fully in the body of the paper is that in practice few problems of optimization are concerned with a single response. Usually there are a number of responses such as yield, purity, color, physical form etc. and, although in theory we could combine all these into a single criterion of value or cost, this is in practice not a useable procedure, for it requires the equating of incommensurable quantities. Questions like: How much does a bad smell cost? At what cost should we assess the blowing up of the plant? How often can we kill all the fish in the river? etc. are not easy to answer. A practical solution of the problem which we have adopted is that of maximizing the principal response such as cost subject to a series of restrictions necessary to keep the other responses at satisfactory levels. A procedure analogous to linear programming is then employed.
- In the response surface problem, what is usually needed is not just the position of the maximum but also the nature of the function in this neighborhood. The existence of insensitivity to changes in specific direction (i.e. ridges) often make it possible to find manufacturing conditions which are near optimal for several responses simultaneously.
- A point which must not be lost sight of is the critical importance that an experimenter's knowledge of the problem plays in any experimental process. I have always felt that the statistician has at least as much and possibly more to learn from the good experimenter than the experimenter has from the statistician. In the process of investigation we have described, the experimenter's mind must be in the circuit of iteration, particularly at the analysis and conjecture stages. This means that the statistician's analysis must be so expressed as to be clearly comprehensible to the experimenter and it must be such as, so far as possible, to present all the facts in an undistorted way. The statistician must remember that it is quite possible that the experimenter will see things in the data which he cannot see because of his lack of special experience in the field concerned. Therefore, he must not filter pieces of information which he feels are irrelevant but which in fact may be critical. The experimenter must be given opportunity to assess the data in relation to hypotheses other than those which are in the statistician's mind.
- The process we have described is rather like the operation of a servomechanism and the rules for good operation are similar to the rules for good operation of such a mechanism. For example, for efficient operation of such mechanism the signal to noise ratio must be reasonably high, otherwise the system will be unstable. Considerations of the plausibility of various hypotheses should be thought of in this regard rather than in terms of formal significance tests.
References
- G.E.P. Box and P.V. Youle, "The Exploration and Exploitation of Response Surfaces: An Example of the Link Between the Fitted Surface and the Basic Mechanism of the System", Biometrics, Vol. 11, No. 3 (1955).
- O.L. Davies and W.A. Hay, "The Construction and Uses of Fractional Factorial Designs in Industrial Research", Biometrics, Vol. 6, (1950).
- Cuthbert Daniel, "Fractional Replication in Industrial Research", Proceeding of 3rd Berkeley Symposium on Mathematical Statistics and Probability (1955).
- G.E.P. Box, Evolutionary Operation, Applied Statistics (1957).
- G.E.P. Box and K.B. Wilson, "On the Experimental Attainment of Optimum Conditions", Journal of the Royal Statistical Society, Series B (1951).
- (6) A.D. Booth, "Numerical Methods", Butterworths Scientific Publications (1955).
- G.E.P. Box and G.A. Coutie, "Application of Digital Computers in the Exploration of Functional Relationships", Proceedings of the Institution of Electrical Engineers, Vol. 103 Part B, Supplement No. 1 (1956).
- G.E.P. Box, "Notes on Non-linear Estimation", Statistical Techniques Group Report, Princeton University.
- (9) R.S. Koshal, "Application of the Method of Maximum Likelihood to the Improvement of Curves Fitted by the Method of Moments", Journal of the Royal Statistical Society, Vol. 96 (1933).
- D.S. McArthur and J.J. Heigl, "Strategy in Research", Esso Research and Engineering Company (1957).