Articles and Reports by George E.P. Box
williamghunter.net > George Box Articles > Role of Statistics in Quality and Productivity Improvement
Role of Statistics in Quality and Productivity Improvement
Copyright © 1993 by George E. P. Box. Used by permission.
Abstract
The role of Statistics in Quality and Productivity Improvement depends on certain philosophical issues which the author believes have been inadequately addressed. Three such issues are: (1) what is the role of statistics in the process of investigation and discovery (2) how can we extrapolate results from the particular to the general and (3) how can we evaluate possible management changes so that they truly benefit an organization.
(1) Statistical methods appropriate to investigation and discovery are discussed as distinct from those appropriate to the testing of an already discovered solution.
(2) It is shown how the manner in which the tentative solution has been arrived at determines the assurance with which experimental conclusions can be extrapolated to the application in mind.
(3) Whether or not statistical methods and training can have any impact depends on the system of management. A vector representation which can help predict the consequences of changes in management strategy is discussed. This can help to realign policies so that members of an organization can better work together for its benefit.
Keywords: Discovery Extrapolation of Results Scientific investigation Statistics in quality Vector representation of management strategy.
This work was sponsored by the Alfred P. Sloan Foundation.
It was presented at the 49th Session of the International Statistical Institute, Florence, Italy,
September 1993.
Introduction
In this paper three philosophical issues are discussed:
- how should we use statistics in investigation, problem solving, and discovery;
- how can we argue from the particular to the general;
- how can we better predict consequences of possible changes in management strategy?
These topics have much wider impact than quality improvement. They raise fundamental issues about the way we use statistics and also the way we teach statistics whether to statisticians, engineers or scientists.
1. Use of Statistics in investigation and problem solving
Quality improvement concerns the setting up of systems that continually use scientific method to generate knowledge without requiring disproportionate new resources. New knowledge can be of three kinds. - knowledge already existing inside or outside the organization that has not been put to use knowledge we can get by observing and analyzing the normal operation of our processes - knowledge that we must generate experimentally. A quality organization must continually strive to improve its acquisition and communication of knowledge of all three kinds. Statistics is involved because the proper study of the statistician is the improvement of scientific investigation by catalysis of knowledge gathering.
Two aspects of scientific investigation are discovery and development on the one hand and testing the result on the other. Consider, for example, a study intended to provide a drug which can cure a particular disease. It has two distinct aspects: a) the process of discovery and development of an effective and manufacturable chemical substance and b) the process of testing to ensure its effectiveness and safety. The first must be undertaken in the same spirit as a detective solves a mystery and finds the criminal. It is necessarily a sequential iterative procedure impossible without subject matter knowledge and intuition necessary for induction. Testing the final product is a much more formal process. It parallels the trial of the accused within very strict rules of admissible evidence. It is usually a one shot affair.
Statisticians are frequently the teachers of engineers and scientists. Unfortunately, they have often been trained only for the role of analyzer of the one shot trials appropriate to test a solution after it has been found. Because we have created too many statisticians with a test-oriented mindset, statistics has often not been allowed to play its critical catalytic role in the processes of discovery and development. This is partly because neither the statistical teachers nor the experimenters know that it has much to contribute at this stage. But it may also be that the Experimenters' contacts with test-oriented statisticians result in their being perceived as a hindrance rather than a help.
Emphasis by Tukey (1977) on the distinction between exploratory and confirmatory data analysis has gone part of the way to address this problem and to restore to respectability methods of exploratory enquiry. However, as he recognizes, exploratory enquiry involves not just analysis but the whole process of investigation and, in particular, the sequential use of designed experiments.
Continuous Never Ending Improvement
A central principle of the new quality technology is that of "Continuous Never Ending Improvement". Since this idea may seem at first to be in conflict with the law of diminishing returns, it deserves careful consideration. Suppose, for example, you have a response curve like Figure 1(a) or more generally a response surface defined by y =ƒ(x), and you want to find the levels of a set of process variables x which maximize the quality characteristic y. Having achieved this maximization, shouldn't experimentation stop? And anyway how much extra effort is it worth to get the last increment?
The above reasoning applies to a fixed model. In real investigations neither the functional form of the model, nor the identity of the variables x, nor even the nature of the responses y is fixed. They evolve as new knowledge comes to light. Experimenters must be allowed to lean as they go. This is illustrated in Figure 1(b) where a possible path of an investigation is shown as it passes through successive phases A, B, C..., with dotted lines indicating "roads not taken".
In practice, a number of responses will usually be measured so that yA, yB, yC will be vectors whose elements may change as may the functional forms ƒA, ƒB, ƒC and the process variables xA, xB, xC which are considered appropriate at the various stages of the ongoing investigation. The statistician skilled in aiding scientific investigation will at each stage illustrate the results graphically so as to appeal directly to the experimenter's imagination, commenting on interesting patterns, pointing to possible structure, and explaining what seems clearly established, what is marginal, and what could easily be due to noise. Thus, an on-going and interactive dialogue with the investigator takes place that may bring up totally unexpected concepts. After careful perusal of various combinations of images on the computer screen and some discussion and thought, the experimenter may say something like, "You know, looking at the effects of variables x2 and x3 on y1 together with how those same variables seem to affect y2 and y3, suggests to me that what is going on physically is thus and so. I think, therefore, that in the next set of experiments we had better introduce new factors x4 and x5 and drop the factor x1."

"But," the statistician responds, "at the beginning of this investigation I asked you to list all of the important variables and you didn't mention x4 and x5".
"Oh yes," the experimenter says, "but I had not seen these results then."
The continual injection of subject matter knowledge can and should change the course of an investigation - the model being entertained, the variables being used, the responses being measured, and the expectation of improvement possible. It may even at times change the object of the investigation - there may be little point in looking for looking further for silver if we unexpectedly strike gold.
Whereas a fixed model leads inevitably to the barrier posed by the law of diminishing returns, the developing model provides for expanding returns and the possibility of never ending improvement. In practice, some level of improvement will be adequate for present purposes and the improvement process may temporarily halt, but this quiescent period will last only until external circumstances again renew the incentive for change.
Statistical methods for exploration and discovery must, therefore, take account of iterative learning. Specifically, how this changes the strategy of experimental design and analysis was discussed, for example, in relation to Response Surface Methodology by Box and Wilson (1951) in relation to Evolutionary Operation by Box (1957), and in a series of papers and books referenced in Box (1993&b). The advantage of using balanced designs such as (fractional) factorials and other orthogonal arrays as basic building blocks in such an iterative study is that, even more important than their statistical efficiency, is that they make it much easier for the investigator to see how the statistical analysis relates to actual patterns of data and to stimulate induction.
From the cradle up, a fundamental way in which the human mind learns about the world is to ask of two entities: are they the same or are they different? These questions become much easier to answer if other possibly relevant circumstances are the same for the things compared. The factorial design is a device par excellence for raising and helping to answer exactly these questions. It stimulates creativity because it allows for the making of a number of comparisons in which only one factor is changed and then asking about these comparisons - are they (approximately) the same or are they (substantially) different? We thus can look at differences and at differences of differences (interactions) in a clear-minded way. By contrast, mathematically "optimal" designs are selected to minimize some criterion chosen in advance for a model assumed to be known in advance in an experimental region exactly known in advance. They cannot be expected, therefore, except in accidental circumstances to produce patterns that aid the induction of genuinely new knowledge.
Scientific Evolutionary Modeling as a Multidimensional Iteration
While the idea that scientific progress is achieved by an iteration involving both induction and deduction goes back at least to Robert Grosseteste in the Twelfth Century (Crombie, 1953). Its importance to statistical philosophy has not been adequately appreciated. Scientific progress typically occurs as a result of iteration - in particular between a tentative model on the one hand and data chosen to explore it on the other, as discussed for example in Box and Youle (1955). Thus, we have the four steps:
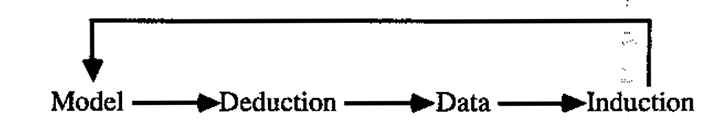
A similar iteration in the quality literature is the Shewhart-Deming Cycle
which drives continuous improvement (Deming, 1986).
Statisticians who have been trained only to run one shot trials and hypothesis tests may be uncomfortable with the idea that scientific investigation requires an indeterminate and flexible model - the responsibility for whose evolution must be shared with the experimenter. In the teaching of statistics, scientific iteration is usually dealt with by pretending it doesn't exist. If we ignore the inductive part and think only in terms of one-shot investigations, then statistics can be rigorously mathematicized. Unfortunately the inductive part, whose contributions cannot be modeled mathematically in advance, is the only place where truly new ideas not latent in the original premises are injected. By cutting a living process of investigation in two, you kill it. The products of such teaching either have to learn how to deal with real investigations on the job or alternatively be shuffled off to plan confirmatory trials after all the truly creative work has been done.
The theory of scientific statistics must include not only its mathematical theory but more fundamentally its scientific theory. The statistician must be trained to consider such basic matters as: the nature of scientific method the process of model building and iterative investigation the roles of design and analysis and of deduction and induction in sequential exploratory investigation the problems of getting meaningful measurements the importance of subject matter knowledge how to work with investigators and problem solving groups how to encourage hypothesis (model) generation how to manage data the distinctions between and the iterative use of model criticism and model estimation the nature of system noise the concept of entropy the modeling of dynamic systems the robustification of empirical extrapolation.
Training for statisticians must include a good deal of time spent on "hands on" problem solving using iterative sequences of real experiments and appropriate analyses. The mere analysis and reanalysis of long dead "data sets" reinforces the passive mindset. To do what is proposed will require major curricular and philosophical change in our statistics departments. If this proves impossible, responsibility for this kind of training should be transferred to engineering and other scientific departments.
2. Problems of Arguing from the Particular to the General
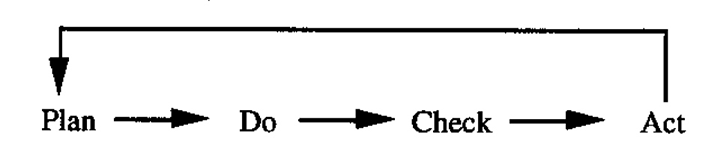
On the left of Figure 2 (full lines) is shown the iterative problem solving process already discussed and sketched from a somewhat different viewpoint in Figure 1(b). The dotted lines indicate how once the problem solving part has ended with a feasible solution, informed extrapolation is needed from the small scale to the full scale, from one location to another, from one operator to another, from one period of time to another, from one raw material supplier to another and so on. Except perhaps for evolutionary operation and other on-line studies it is rare for the results of an investigation to be applied within the context in which it was conducted.
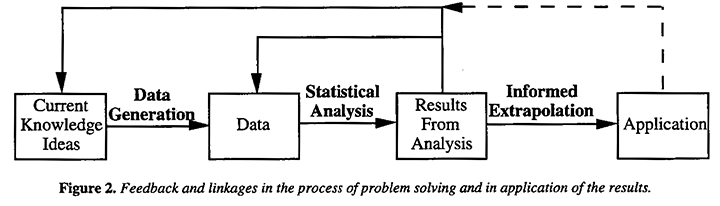
In particular, as was emphasized by Deming (1950, 1986), for "analytic" studies, the reference set which defines the hypothetical population within which standard significance tests and confidence intervals have relevance is usually vague and is in any case rarely the reference set of actual application. Extrapolation from the experimental environment to that of the actual application must therefore be based largely on technical judgment and subject matter knowledge, not on the direct use of formal probability. But the assurance with which such an extrapolation can be made using subject matter knowledge depends very much on how the experiments have been conducted. Consider the dilemma of persons responsible for approving an expensive modification to a process. They will feel very differently if the evidence favoring the modification is based on: (a) a single comparison made in a test-tube or (b) an investigation in the pilot plant of all the process and environmental factors likely to be relevant. Although no absolute guarantees are possible, the statistician can make the job of informed extrapolation less perilous by making robust at minimal cost the analytical and judgmental links that connect investigation and application.
Two somewhat different kinds of robustness are involved. We need to ensure that the processes of data generation and analysis leading iteratively to what appears to be a feasible solution are inference robust. That is to say that they lead to reliable conclusions at least within the necessarily limited reference set covered by our experimentation. In particular, they do not mislead because of moderate violations of assumption such as are likely to occur. But, in addition, we need to conduct our experiments so that they are extrapolation robust - so that there is the best possible basis for extrapolation from the conclusions that the experiment produces to the real application. This requires means for robust investigation and particularly of robust experimental design of the kind recommended, for example, by Fisher (1925), Michaels (1964), and more recently by Taguchi (1986, 1987). The precautions we need to take involve issues of philosophy, analysis and design and will be discussed under the following headings:

(a) Nature of system noise
Statistics is frequently taught as if the ordinary state of a system output can be represented by independent, identically distributed (IID) random variables and more recently, perhaps, by serially correlated random variables forming a stationary series. In either case, the state of disorganization of the system represented by its entropy is assumed to remain constant and the process may be said to be in a state of "control". However, common sense and the second law of thermodynamics tells us that, for any uncontrolled system which is allowed to develop in time or space, the entropy will usually increase steadily and would need to be represented by some kind of non-stationary model. Indeed, an assumption of non-stationary noise is necessary to justify such basic tools as the proportional-integral feedback controller. The stationary state is one that does not occur naturally but can sometimes be approximately induced artificially, for example, by a steady elimination of the larger disturbing factors and/or by feedback control (see also Box and Kramer, 1992) or allowed for in experimentation by blocking and randomization.
It is sometimes argued that before we run any experiments the studied process must be brought into a state of strict control. Whether any process ever existed in such a state seems dubious, but certainly there are cases where this has, perhaps, been achieved to an adequate approximation. However, to justify experimentation on this basis we need to believe that this state of control will be maintained in experimental conditions which we have yet to try. Thus, while every effort must be made to ensure that an experimental system is in the best state of control we can get, we would be sanguine indeed to rely absolutely on an assumed state of control to make our conclusions valid. Fisher's design of experiments involving blocking and the physical act of randomization was introduced so that valid experiments could be run on material (in particular agricultural land) which was it was assumed was not in a state of control. For most industrial experiments the same assumption would be appropriate.
(b) Inference - robust analysis
It can be argued that robust statistical analysis requires no more than that models be sparingly but adequately parameterized (Jeffreys, 1932 Box and Tiao, 1973). In this connection it must be remembered that omission of a parameter is the same as including it in the model and adamantly fixing its value equal to zero. Models cannot be exactly true but ought not to be incredible. In particular, a model explicit or implicit which fails to allow for some fundamental parameter can be disastrous. For example, many observational phenomena occur in sequence in time or space where continuity obviously requires that dependence between observations is to be expected. When this is not allowed for, the results can be disastrous (see, for example, Box and Newbold, 1970). For such data assumptions of independence or interchangeability lack any logical basis and without randomization, so called "distribution free" tests, although free on frequentist theory of the assumption of normality, continue to make the same devastatingly dangerous distributional assumption that errors are interchangeable. Standard "least" squares models are equally incredible for another reason. They implicitly assume that the occurrence of a "bad" value has zero probability. Sensible procedures allowing for the possibility of bad values will tend to yield stable estimates which are substantially different from those given by least squares (see for example Tukey, 1960 Huber, 1981) however, as for other deviations from a "standard model", reparameterization of the model to allow for reality seems the most satisfactory basis for "robust estimation" (Box, 1980, 1983).
(c) Graphical exploratory analysis
Graphics showing, for example, a plot of one response against another, cube plots of factorial data, Daniel (normal) plots of effects (Daniel, 1959, 1976), reference distributions for comparisons and residual plots (see for example Tukey, 1977) and approximate response surface fits, can make a direct appeal to the right brain and to the subject matter knowledge of the investigator. It is in this way that appropriate model modification and new hypothesis generation can be achieved.
(d) Nature of the investigational process
Iterative investigation of the kind illustrated in Figure 1(b) itself makes an important contribution to extrapolability. Such a strategy opens up a wide range of possibilities not originally in mind, and the problem of eventual extrapolation (including, for example, eventual manufacturability) should be one of the factors taken into account in the successive choices that are made in following the path of investigation. It should be understood that these choices relate not only to formal statistical design and analysis, they also encompass for example, "brainstorming", the use of the "Seven Tools" of Ishikawa (1976), computer graphics, and other methods which encourage induction.
(e) Need for planned experimentation
The desirability of designed experiments becomes clear as soon as one considers the hazards of analyzing happenstance data. These hazards include (see, for example, Box et al, 1978): inhomogeneity of data near colinearity of the x's nonsense correlation through "lurking" intermediate variables possibility of serially correlated errors and the possibility of dynamic relationships and feedback effects. After earlier experiences showing the limitations of such data Fisher, encouraged by Gosset, realized in the 1920's (Pearson, 1990) that to address the specific questions of interest and to avoid traps of the kind listed above it would be necessary to design experiments rather than to rely on observational data.
From the beginning, three concepts were of great importance: minimizing experimental error allowing for factor interaction and maximizing extrapolability. Accepted wisdom said you should vary only one factor at a time whereas minimization of error transmission required that factors were varied together by, for example, the use of a factorial design. This also provided estimates of interactions. Furthermore, it had been believed that to control experimental error, every ingredient and circumstance must be standardized, implying heavy reliance on lab experimentation. But extrapolating the results of such a narrow experience was likely to be extremely unreliable, for example, conclusions drawn from laboratory experimentation would often not be borne out on the farmer's field. Fisher's aim was to solve all these problems simultaneously.
(f) Randomization and blocking
In the real world, experimental runs must often be made in sequence in time or space. The disturbance affecting the system cannot then be relied on to be like the stationary disturbance S in Figure 3 but is likely to resemble the non-stationary disturbance N in that figure (see, for example, Wiebe, 1935 Box, 1984). It is argued in Box and Kramer (1992) that such non-stationary behavior is to be expected for any system developing naturally in time or space. Design (1) in Figure 3 shows four treatments A B C D applied systematically. Design (2) shows the same treatments arranged in a randomized block design. Obviously either design yields equally valid comparisons for the disturbance S. However, Fishers randomized block design makes the statistical conclusions robust against the possibility of a disturbance such as N.

Randomizing and blocking also simultaneously reduce error and increase extrapolability. While blocks are chosen so that the variation within a block (which determines experimental error) is minimized, at the same time, differences between blocks can deliberately be chosen wide enough to aid extrapolation. For example, in the first randomized block design described by Fisher (1935) in his book "Design of Experiments", five varieties of barley were compared within twelve blocks consisting of six locations in the state of Minnesota in each of two different years. Testing the five types of seed over this wide variety of conditions provided what Fisher called a wider basis for induction (i.e., extrapolability). These data showed, in fact, that one particular seed variety did best in eight of the 12 blocks and quite well in the others. This would reassure the Minnesota farmer of its likely value to him (of the extrapolability of the result) much more than a trial made in the laboratory or at one farm in one year. Much earlier in the century, similar considerations motivated experiments to test a number of varieties of barley in different locations and farms in Ireland. The object was to provide high yielding and reasonably uniform raw material for the Guinness Brewery.
(g) Comparative experimentation
Experiments which most strain extrapolation are those concerned with an absolute measurement, for example, of the diameter of a rod. Youden (1972) discussed data from various experiments to measure the velocity of light. These had been made at different times, in different places, by different investigators. He pointed out that no two of the resulting confidence regions overlapped. Also, it is well known to practicing statisticians that when different labs test an identical sample, wide differences between labs accompanied by excellent reproducibility within labs is frequently found. A safe assumption is that any method of absolute measurement is likely to be seriously biased unless proved otherwise.
Comparative experiments from which you wish to learn if A and B are different and by how much are less troublesome. For example, a method of measuring the velocity of light, even though biased, might be used to answer the question, "Does light travel at different speeds in air and a vacuum?" It is of note that all of the discussions in Fisher's classic book The Design of Experiments are about comparative experiments.
It is often possible to transform a problem of absolute measurement into one of comparative measurement. For example, in the manufacture of certain automobile parts, a robot grasps each item as it comes off the line and makes a series of measurements. However, these measurements are not compared with standard values. Instead, after measuring each manufactured item, the robot moves back to measure a standard "perfect pan", which is available for continuous reference. The differences in the measurements of the manufactured part and the standard are used to decide whether or not the part is in conformance. The advantage to this procedure is that bias in the measurement procedure will be equally reflected in both the measured part and the reference part.
(h) Factorial and orthogonal experimentation
Besides their ability to aid induction, factorial experiments have the well-known advantage that they make it possible to test the effects of a number of factors with the same precision as if the whole experiment had been dedicated to testing a single factor. In addition, they provide information on how each factor interacts with the others. As is illustrated in Figure 3, this can be done while maintaining the precautions of randomization, blocking and comparative experimentation.
However, in his advocacy of factorial experimentation, Fisher (1935) also had in mind the question of what we have called here extrapolation robustness. He remarked, "... any conclusion ... has a wider inductive basis when inferred from an experiment in which ... (other factors) had been varied, than it would have from any amount of experimentation in which these had been keep strictly constant. ... a highly standardized experiment supplies direct information only in respect of the narrow range of conditions achieved by standardization."
He goes on to say, "(extraneous factors) may be incorporated in (factorial) experiments designed primarily to test other points with the real advantages that if either general effects or interactions are detected, that will be so much knowledge gained at no expense to the other objects of the experiment in any case, there will be no reason for rejecting the experimental results on the ground that the test was made in conditions differing in one or other of these respects from those in which it is proposed to apply the results." These ideas were extended further by Youden (1961 a, b), who was then working at the Bureau of Standards, to develop what he called "rugged" methods of chemical analysis. His experiments used fractional factorial designs (introduced by Finney, 1945) to further increase the number of extraneous factors that could be included.
Experiments of this kind can also be called sensitivity experiments and the ideas directly parallel those of sensitivity analysis. Such experiments can tell us which factors have detectable effects but, equally important, which factors do not. Any proposal to employ a new or modified process or product raises fears of the unknown. Particularly when a process has given trouble we may hear an impassioned cry from those in charge."It's working now. Please don't touch it!" The implication of this remark is that the process operators believe they are working in the dark within narrow constraints but they have no idea where these are. When many factors have been tested in the experimental work leading to the process, this can provide information on what are likely to be the few vital factors that must be carefully controlled and which factors do not matter very much. With such information, the process operator is on much firmer ground. Notice that because of the projective properties of fractional factorials and other orthogonal arrays, these designs are particularly appropriate for this problem of sorting the "sheep from the goats" (Box and Hunter, 1961 Bisgaard, 1987 Lin and Draper, 1992 Wang and Wu, 1993 Box and Tyssedal, 1994).
(i) Robust product design
From the above it will be seen that the concept of using statistics to design a product that will operate well in the conditions of the real world clearly has a long history going back at least to Gosset in the early part of the century. An early industrial example of this concern for robust extrapolability is due to Michaels (1964). After explaining the usefulness in industry of split plot designs (often synonymous with Taguchi's, 1987, inner and outer arrays), he illustrates with a problem of formulating a detergent. Michaels says, "Environmental factors, such as water hardness and washing techniques, are included in the experiment because we want to know if our products perform equally well vis-a-vis competition in all environments. In other words, we want to know if there are any Product X Environment interactions. Main effects of environment factors, on the other hand, are not particularly important to us. These treatments are therefore applied to the Main Plots and are hence not estimated as precisely as the Sub-plot treatments and their interactions. The test products are, of course, applied to the Sub-plots."
Earlier Morrison (1957) described and illustrated with a worked example the problem of designing a system robust to the effects of error transmission from its components. In addition, he made two important points which were later missed (a) that this is a problem in numerical minimization (not requiring inner and outer arrays or, indeed, an experimental design of any kind) and (b) that the solution is extraordinarily sensitive to what is assumed about the variances of the components (see also Fung, 1986 Box and Fung, 1994 and remarks in the discussion edited by Nair, 1992).
Although we owe to Taguchi (1986, 1987) demonstration of the wide industrial importance of robust design ideas, we do not employ his specific techniques at Madison. Instead, we discuss all the points (a), (b), (c), (d), (e), (f), (g), (h), and (i) above which we feel provides a much broader picture of the question of extrapolability. Also, we use what we believe are simpler and more efficient methods which, in particular, take account of the important points made by Morrison and Michaels (Box, Bisgaard, and Fung, 1988). We have also taught industrial short courses incorporating these ideas to engineers and scientists in many parts of the world.
3. Assessing Possible Changes In Management Policies
The extent to which methods of quality improvement can be effectively used depends critically on the management culture in which they attempt to operate. Ways to consider prospective management changes can help to distinguish between initiatives likely to produce real improvement and mere "window dressing".
Assessing Effects of Changes in Management Strategy
The management of any business or system depends on a large number of individual policies. These can involve questions of hiring and firing, of remuneration, of promotion, of who can sign off on a given amount of money, of who can give instructions to alter a process, of the length and frequency of rest periods and so forth. In particular, they involve questions of worker involvement, cooperation, and empowerment. The relevant policies are the de facto policies applied in practice, not necessarily those that are written down. I will suppose that we can measure on some continuous scale the degree x1 with which the ith policy is employed. Also suppose that there is some measure of perceived value y which can be attributed to any management strategy defined by some combination of n such policies. Such perceived value will, of course, depend very much upon the perceiver.
Then in the n -dimensional policy space, the vector x = (x1, x2, ..., xn) defines a point which corresponds to a particular management strategy Suppose for some particular ith individual, the perceived value of the strategy x is yi = ƒi (x) and let a particular point O with coordinates x0 correspond to the current management strategy.
In practice, a management strategy would involve a very large number of policies. However, for purposes of illustration, we can consider a strategy defined by just n = 2 policies x1 and x2 with, say, x1 the degree of worker involvement and x2 the degree of worker remuneration. An imaginary situation as seen from various points of view is shown in Figure 4. Figure 4(a) shows the perceived value contours of yw = ƒw (x) for a particular worker w. These are labeled yw= 1, yw = 2 and yw = 3 where a large number indicates that the perceived value is better. The arrow indicates the consequent direction of change which the worker perceives to be of greatest personal benefit. Figure 4(b) shows contours of ym = fm(x) where m refers to a particular middle manager with the direction of change which s/he perceives as of greatest personal benefit. Figure 4(c) similarly shows contours of yu= ƒu(x) and the desirable direction of change for that member of upper management. In Figure 4(d), y = ƒ(x) is supposed to represent the "real" value of the various strategies to the organization. This illustration shows: (a) the worker anxious to increase his involvement as well as his remuneration (b) the middle manager in favor of less worker involvement and no change in their remuneration (c) the upper manager wishing to see workers more involved but paid less and (d) the "true" interests of the organization which would require increased worker participation at the same level of remuneration. In my imaginary example the arrows point in widely different directions indicating the likelihood of conflict both overt and covert in this organization.
Management Problems and Abuses
Management systems have often been demonstrably inefficient. Thus, for example, C. Northcote Parkinson (1957) provided data which showed that the bureaucracy responsible for overseeing the British Empire continued to increase at the same time that the Empire itself was in decline. Present day bureaucracy, even with the advantage of modern management systems, seems similarly afflicted - whenever the tax system is simplified it needs more people to run it. These and other ailments have been the subject of much study and a variety of nostrums have been proposed, each of which has, in its turn, been promoted as an infallible cure, but doubts remain.
Returning now to the ideas illustrated in Figure 4, it seems that to achieve an efficient management system requires, among other things that we:
- a) agree what is a desirable direction for the organization to take and
- b) so far as possible, ensure that everyone in the organization moves in that direction.
Suppose that the best direction of change for the organization can be agreed. What we then need is some galvanizing force which can get everyone to move in that direction in very much the same way that an electric solenoid can magnetize a steel bar by re-orienting all its individual molecular magnets as in Figure 4(e).
One such motivating force is fear. In a hierarchical classification, a worker at a lower level reports to a supervisor one step up and so on. This was a system originally developed to run an army engaged in an enterprise that the soldiers might or might not think worthwhile. It is a system designed to ensure that in all circumstances people do what they are told to do. Fear as a motivation is inefficient and expensive (see Deming 1986)*. For maximum effectiveness it would require that everyone watched everyone else all the time. It is inefficient (a) because even with a very large and expensive force of supervisory personnel, complete and continuous surveillance is impossible and (b) because such a system breeds resentment. Such resentment can be expressed in many counterproductive ways - carelessness and petty thievery, for example – which are covert and hard to deal with.
Another motivator is personal power. However, the employee whose main aim is to accumulate personal power can be a hindrance rather than a help to the overall good of the enterprise. The upwardly mobile executive who knows that s/he will almost certainly not be in the present job in 18 months' time can afford to take a very short term view. The best interests of such a person are served by making changes which, whatever their long term effect, will produce highly visible results in the short run. As Dobzhansky (1958) says, "Extinction occurs because selection promotes what is immediately useful even if the change may be fatal in the long run" (see also, Potter, 1990). The flow diagram, one of the simplest inductive graphical tools of quality improvement, often provides food for thought. It seems, at first, surprising that such diagrams frequently reveal useless loops and delays which have become institutionalized over the years. However, if the only way that a supervisor in charge of a staff of four can have more power and be more highly paid is to be in charge of a staff of twenty, then there is clearly a disincentive to replace an unnecessarily complex system by a simpler one.
* Even in its military application the affectiveness of fear is dubious. It seems likely, for example, that soldiers fight best when they believe they fight for a good cause and, in particular, for the survival of their families and their country, and not very well otherwise.
To feel powerless is certainly a demotivator. If, for example, the private belief of employees is that the new data they are to collect may threaten their employment and that of their colleagues, they may be less than enthusiastic in ensuring that a good job of data collection is done.
A simple view is that human beings will not ultimately perform at their best unless they believe that they are serving their own interest, are respected, and enjoy at least some of the things that they are doing. In particular, most employees welcome process improvement jobs that exercise rather than stifle their natural creativity. It is slowly being realized that when they know that are serving their own interest, very little supervision is needed - only training and leadership.
Because "water runs down hill", the central principal of good management must surely be to continually try to arrange "the contours of everyone's hill" so that when water runs down hill, it runs the way that benefits the organization. As we were reminded by Abraham Lincoln, while it is possible in the short run to deceive people about what is in their interest, it is not a sustainable policy. But even well meaning efforts are sometimes unsuccessful or counterproductive so careful thought and some experimentation is necessary. Self interest motivators will not necessarily take the same form at all levels of management, but a motivator aimed at one level should not demotivate people at another level. For example, top executives&rsquo salaries when they are orders of magnitude higher than those for process workers are perhaps motivating for those that receive them but can be highly demotivating for the lower paid. In trying to balance many factors, the motivating vector representation of Figure 4 may prove to be a useful way of thinking about the likely effects of particular policy changes contemplated in an organization.
The inherent motivators in any management organization will also determine by a process of natural selection the kind of individuals who will rise to its highest positions. If leadership is the motivator, it will produce leaders, if power - the power-hungry, if fear - the tyrant, and so forth.
This paper deliberately says very little about particular methods and techniques. But the choice of techniques and methods become much clearer once certain philosophical concepts are understood. These concepts concern the role of statistical methods in: 1) investigation, creativity, and problem solving 2) the extrapolability of solutions found and 3) achieving a management climate in which quality improvement can be conducted.
In summary, we see that efficient knowledge generation and learning about every aspect of an organization is the essential driver of all quality and productivity improvement, and that where necessary, management must change so as to induce this to happen. Every teacher knows that the best way to learn a subject is to teach it. So long as there is the required total knowledge in a group, well-facilitated group learning - where the members of the group learn by teaching each other - can be a most effective and rapid approach. In the Renaissance, work, play, and education were separated. As a consequence, we are not expected to learn or play while working. The truth may be that learning takes place most rapidly when people do all three things at once.
Acknowledgements
I am particularly indebted to Richard Jarret, W. Lee Hansen and J. Stuart Hunter for their help in improving this manuscript.
This research was supported by a grant from the Alfred P. Sloan Foundation.
Bibliography
- Bisgaard, S. (1989), "The Quality Detective: A Case Study," Phil Trans. R. Soc. Lond., A 327. pp.499 511.
- Bisgaard,S. (1987), "Fractional Factorialsand Other OA's," An Explanation of Taguchi's Contributions to Quality improvement. Industrial Course Notes. Department of Engineering Professional Development University of Wisconsin-Madison.
- Box, G. (1993a), "Sequential Experimentation and Sequential Assembly of Designs," Quality Engineering, 5. pp. 321-330.
- Box, G. (1993b), "Statistics and Quality Improvement," J. Roy. Stat. Soc., Series A. to appear.
- Box, G.E.P (1984), "Anatomy of Some Time Series Models," Statistics: An Appraisal, Proceedings 50th Anniversary Conference. H. A. David and H. T. David, (eds). Iowa State University Press.
- Box, G.E.P. (1980), "Sampling and Bayes" Inference in Scientific Modeling and Robustness," , J. Roy. Stat. Soc., Series A, Vol. 143. pp. 383-430.
- Box, G.E.P. (1957), "Evolutionary Operation: A Method for Increasing Industrial Productivity," Applied Statistics, Vol. 6. pp. 81-101.
- Box, G.E.P., S. Bisgaard and C. Fung (1988), "An Explanation and Critique of Taguchi's Contributions to Quality Engineering," Quality and Reliability Engineering international, 4. pp. 123-131.
- Box, G.E.P. and N.R. Draper (1976), Evolutionary Operation. John Wiley New York.
- Box, G. and C.F. Fung (1994) "Is Your Robust Design Procedure Robust?" Quality Engineering, Vol. 6, No. 3. pp. 503-514.
- Box, G.E.P. and J.S. Hunter (1961) "The 2k-p Fractional Factorial Designs," Technometrics, Vol. 3. pp. 311-351,449-458.
- Box, G.E.P., W.G. Hunter and J.S. Hunter (1978), "Statistics for Experimenters". John Wiley Sons New York.
- Box, G. and T. Kramer (1992), "Statistical Process Monitoring and Feedback Adjustment-A Discussion," Technometrics, Vol. 34, No. 3. pp. 25 1-285. Box, G.E.P., T. Leonard and C.F. Wu (1983), "An Apology for Ecumenism in Statistics," Proceedings of a Conference Conducted by the Mathematics Research Center, The University of Madison, November 4-6, 1981. Academic Press New York.
- Box, G.E.P. and P. Newbold (1970), "Some Comments on a Paper by Coen, Gomme, and Kendall," J. Roy. Stat. Soc., Series A, 134. pp. 229-240.
- Box, G.E.P. and G.C. Tiao (1973), Bayesian Inference in Statistical Analysis. John Wiley Sons New York.
- Box, G.E.P. and J. Tyssedal. (1993), "Projective Properties of Certain Orthogonal Arrays," Technical Report #116. Center for Quality and Productivity Improvement University of Wisconsin-Madison.
- Box, G.E.P. and K. B. Wilson (1951), "On the Experimental Attainment of Optimum Conditions,"; J. Roy. Stat Soc., B, 23.pp. 1-45.
- Box, G.E.P. and P.V. Youle (1955), "The Exploration and Exploitation of Response Surfaces: An Example of the Link Between the Fitted Surface and the Basic Mechanism of the System," Biometrics, Vol. 11. pp. 287-323.
- Crombie, A.C. (1953), Robert Grosseteste and the Origins of Experimental Science. Oxford London.
- Daniel, C. (1976), Applications of Statistics to Industrial Experimentation. Wiley New York. Daniel, C. (1959), "Use of half-normal plots in interpreting factorial two-level experiments," Technometrics, 1. pp. 311-341.
- Deming, W.E. (1950), Some Theory of Sampling. Wiley.
- Deming, W.E. (1986), Out of the Crisis. MIT Press Cambridge, MA.
- Dobzhansky, T. (1958), "Evolution at Work," Science. pp. 1091-1098.
- Finney, D.J. (1945), "Fractional Replication of Factorial Arrangement," Annals of Eugenics, 12. pp. 291-301.
- Fisher, R.A. (1925), Statistical Methods of Research Workers. Oliver and Boyd Edinburgh.
- Fisher, R.A. (1935), The Design of Experiments. Oliver and Boyd Edinburgh.
- Fung, C.A (1986), "Statistical Topics in Off-line Quality Control," Ph.D. Thesis, UW-Madison.
- Graves, S. (1993), "Compensation and Employment Security: Overlooked Keys to Total Quality," Report, #104, Center for Quality and Productivity Improvement. University of Wisconsin-Madison.
- Huber, P.J. (1981), Robust Statistics. Wiley New York.
- Ishikawa (1976), Guide to Quality Control. Asian Productivity Organization.
- Jeffreys, H. (1932), "An Alternative to the Rejection of Observations," Proc. R. Soc. Ser. A, 137. pp. 78-87.
- Levine, D. and L.D. Tyson (1990), "Participation, Productivity, and the Firm's Environment," pp. 183-243 in Blinder A.S., (ed). Paying for Productivity, Brookings Institution Washington, DC.
- Michaels, S.E. (1964), "The Usefulness of Experimental Design" (with discussion), Applied Statistics, Vol. 13, No. 3. pp. 221-235.
- Morrison, S.J. (1957), "The Study of Variability in Engineering Design," Applied Statistics, Vol. 6, No. 2. pp. 133-138.
- Nais, V.N. (1992), "Taguchi's Parameter Design: A Panel Discussion," Technometrics, 34. pp. 127-161.
- Parkinson, C.N. (1957), Parkinsons Law and Other Studies in Administration. Houghton Mifflin Boston.
- Pearson, E.S. (1990), "Student' Statistical Biography of William Sealy Gosset. R.L. Plackett and G.A. Baunard (eds.). Oxford London.
- Potter, V.R. (1990), "Getting to the Year 3000: Can Bioethics Overcome Evolution's FatalFlaw,Perspectives in Biology and Medicine, 34. pp. 89-98.
- Stallings, B. (1993), "The New International Context of Development," Items, Social Research Council, 47. pp. 1-11.