Articles and Reports by George E.P. Box
williamghunter.net > George Box Articles > Statistics for Discovery
Statistics for Discovery
Copyright © 2000 by George E. P. Box. Used by permission.
Abstract
The question is discussed of why investigators in engineering and the physical sciences rarely use statistics. It is argued that statistics has been overly influenced by mathematical methods rather than the scientific method and consequently the subject has been greatly skewed towards testing rather than discovery. This has had unfortunately results in particular teaching by statistics departments has perpetuated this bias and engineers and scientists are largely unaware about appropriate statistical techniques could greatly catalyzed their investigation.
Success and failure of Statistics as a tool for Scientific Investigation.
Statistics has had great success in the medical, social, and agricultural sciences. One can scarcely pick up a Journal in these subjects without seeing that investigators are using statistics and that they regard it as essential in a great many of their investigations.
However, in engineering technology and the physical sciences, things are different. Even though there is probably more investigation in these areas than in any of the others, one is hard put to find articles in which statistics is even mentioned. The attitude is often - Statistics? Who needs it? I think we should consider why this might be.
Investigations in the social, medical and agricultural sciences are usually done "in-parallel". The treatments, plots, subjects are all set out at one time and then months. Sometimes years, later, the data become available and we consider what can be said about the questions that were asked at the beginning. The investigation is a single entity in a fixed frame proceeding rather slowly. Broadly speaking it is concerned with resting. Analysis of the data tells us something about the model, hypotheses, etc. we started with using some form or other of probability calculus.
In the physical and engineering sciences however data usually become available much more quickly within hours, days and sometimes even minutes, a situation I will call that of immediacy. Immediacy makes it necessary for investigators to look at what they have just done, and immediately ask the question "so what should we do now?" They are involved not so much in testing, but in the process of sequential learning*. They must look back at the questions originally asked, but also they must immediately consider what they should do next. Thus, in the physical sciences and engineering, experiments should be planned so they not only answer old questions, but also help to pose new ones.
*This also happens, of course, in the social, medical and agricultural sciences but there the lack of immediacy results in a very different environment in which the investigator must work.
Iterative exploration and discovery
Deming (1986) proposed that exploration and discovery should be conducted using what is now called the Shewhart-Deming cycle. This uses the iteration - plan-do-check-act, usually inspiring a further cycle of plan-do-check-act and so driving what he called "continuous never ending improvement". In practice the iteration continues until a point is reached where, temporarily at least, knowledge is advanced to a satisfactory level. In industry, for example, this point might be when the investigation has gone far enough to sufficiently out-distance the competition. In academia this point would be reached when advances had been made that merited publication. But in both cases the need for further knowledge would require that the cycle would be continued, either by the same or different investigators.
I illustrated this iterative development of knowledge some years ago (Box and Youle. 1955) with a saw-tooth diagram representing the sequence data-induction-modeI-deduction and so on. Perhaps we start with some data or facts, from which we induce a possible model, theory. Hypotheses, conjecture, or idea. (I will regard these as essentially the same thing and use the word "model" to encompass them all.) The induced tentative model then leads us by a process of deduction to consider what kinds of things should happen if that model were true and what data we ought to get to compare what we thought would happen with what actually occurred. The nature of the discrepancies would then lead us to induce an appropriately modified model and so on. The necessary data might be obtained by going to the library, looking at the process, or running an experiment, but I will consider only the last possibility here.
The idea that knowledge is generated by such a cycle is not exactly new.Francis Bacon discussed it and I am indebted to Steve Steglet for pointing out that Bishop Robert Grosseteste, one of the founders of Oxford University, also talked about it and attributed it to Aristotle. But this process is not esoteric, it is something we experience every day. To exemplify with an illustration I have used before (Box, 1994)-suppose a man is fortunate enough to have his own parking place marked with his name, and he parks his car there every day. On a certain day he leaves work in the afternoon, and his model is that: today is like every day. One of his deductions from this is: my car will be in its parking place. But the data says: it isn't. Induction says: someone must have taken it. His new model is: my car has been stolen. One of his deductions from that is: my car will not be in the parking lot. The data says: No, it's over there! So he induces that: someone took it and then brought it back. His new model is: a thief took my car and brought it back from which he deduces: my car will be broken into. The data says: no it is unharmed and is locked. His induction is that: someone who had a key took it. Finally his model is that: my wife used the car, his deduction is: she probably left a note; and the data says: yes here it is.
The same thing happens in a scientific investigation. Suppose a statistician and an investigator are working together and, say, a factorial or fractional factorial experiment with factors A, B, C, D, E has been carried out, and a number of different responses: y1, y2, y3, y4, determined for each run. The statistician says what he thinks is noise, what he thinks are real effects and so on and presents his conclusions as clearly as possible to the investigator preferably by using computer graphics. After studying this analysis, the investigator might say, "Now, looking at the effects of B and C on the response y1, together with how C and E affect y3 and y4, suggests to me that what is going on physically is thus and so. Therefore I think that in further experimentation we should introduce the new factors of F and G and drop factors A and D."
A statistician who thinks only in terms of a fixed frame might say, "But at the beginning of this investigation I asked you to list all the important factors and you didn't mention F and G" and the investigator will most likely reply, "Oh yes, but I hadn't seen these results then." In this example the investigator induced a new model which might explain physically what was happening and deduced that if this an explanation were correct the situation would probably be illuminated further by introducing two new dimensions F and G in the factor space. This illustrated how the induction phase of the iterative cycle always requires subject matter knowledge*.
*Here and later it is convenient to discuss scientific iteration in terms of an exchange between a statistician who is an expert in the efficient knowledge generation, and an investigator who is an expert the in subject matter specialists. However, with appropriate statistical training, engineers and other subject matter specialists can themselves acquire basic statistical skills. The exchange I discuss would then take place within the brain of a single person playing the dual role of statistical and investigator. Appropriate training does of course require that statisticians are equipped to instruct engineers and other investigators in the tools and the philosophy of iterative investigation.
The difference between fixed frame and iterative investigations is further illustrated by considering the apprehension and trial of a murder suspect. In the trial there is a judge and a jury before whom, under very strict rules, all the evidence must be brought together at one time and the jury must decide, whether the hypothesis of innocence can be rejected beyond all reasonable doubt. This is very much like a statistical test.
But the apprehension of the defendant by a detective will have occurred by a very different process. Beginning with certain facts concerning the circumstances of the murder, sequential investigation might lead Sherlock Holmes to the eventual conclusion that it was the butler who did it. Hercule Poirot faced with the same initial evidence, but almost certainly proceeding by a different route, could end up with the same conclusion. It is not uniqueness of course but converge that is important in iterative learning. The approach of a detective closely parallels that of a scientific investigator.
Thus when Sherlock Holmes considers whether it would be most helpful to talk to the one-eyed ticket collector at Baker Street Station or to look under Lady Cynthia's window for a possible telltale foot print, he is choosing (designing) an experiment. After he performs that experiment he considers whether things are the way he thought they would be, or if not, in what way they differ, and this helps him towards the next step. Obviously the process is likely to be most successful when the skillful generation of good data is accompanied by good judgment.
The history of flight provides a similar contrast. At the end of the 1800's, a lot of people were thinking about airplanes. Among them was Samuel Pierpont Langley, perhaps at that time, the most distinguished scientist in the United States; he had studied aerodynamics - the formula for the lift of an aerofoil and other related matters - and had actually built small model airplanes that flew. The US government gave him $80,000 to build a full sized airplane. He designed this using only his knowledge of his models and of the theoretical formulae which should have allowed him for scale-up in a full size machine. But the plane he built never flew. At a disastrous demonstration in Washington it dropped straight into the Potomac almost drowning the pilot (who was not Pierpont Langley).
Most iterative investigations involve multi-dimensional learning: in particular how to study the problem is a necessary precursor to how to solve the problem. Successful flight was achieved by just such a multi-dimensional iteration; for it was necessary to discover how to design an airplane, how to make an airplane and how to fly an airplane. Two bicycle mechanics, Wilbur and Orville Wright, solved these problems. In 1901 they flew large kites, in 1902 they flew gliders, almost killing themselves in the process; and in 1903 they built an airplane that flew.
This was achieved by iteration between theory and practice. The machine had to be capable of flying with a man and an engine, so it was necessary to be able to calculate the lift of an aerofoil of given shape and dimensions moving through the air at a given speed. When during the course of their investigations it became clear that the accepted formula for determining lift was wrong, the brothers built their own wind tunnel and re-determined the formula. From this they could calculate how much power the engine would have to produces and what was its maximum weight. They could find no one who would build a light but powerful engine to their specifications, so they designed and built their own.
What was it that they were doing? It was not optimization in a fixed factor space. Rather they were seeking the appropriate factor space and the best conditions within that space by an iteration between theory and practice. It is a quest which has continued ever since and still continues. When we look at the Boeing 747 or the Airbus, for example, we see that while the basic concepts of the Wright brothers' airplane have been preserved. Continuous never ending improvement has added a myriad of new dimensions to the factor space not throughout of in 1903 and within which exploration has continued.
Can Statistics catalize iterative investigation?
A reasonable question to ask might be, is statistics really appropriate to catalyze the iterative learning process? Certainly mathematical statisticians have tried to design experiments within the fixed frame that they are accustomed to. They have done this by assuming as known:
- the Identity of the active Factor Space;
- the location of the Experimental Region in this Space (where it is assumed that everywhere within the region is important and everywhere outside it is of no interest)
- what would be an Adequate FunctionalApproximation over this region;
On these assumptions they were able to derive experimental designs that were, D-optimal, A-optimal. E-optimal and so forth (see e.g. Kiefer 1959, 1975). Each of these optimality criteria relates to one single aspect of the covariance matrix of the estimated coefficients, which would reach an extremum if all the things assumed to begin with were true(see e.g. Box, 1982). I believe, however, that when you ask an investigator the questions, which factors are important? Which region is important? and so forth, s/he will say "Well, we don't know, that's one of the reasons we're running these experiments. We have to find out". In any case alphabetically optimal designs are structured only to look backward to the original model and except by accident will be of little help in deciding how it should be changed.
A more sophisticated view is that experimental design serves a number of functions any subset of which might be important in appropriate circumstances (see e.g. Box and Draper. 1975). I will mention only three of these - to achieve noise reduction, to discover complex relationships, and to facilitate induction.
The second of these is illustrated by an elementary example from an investigation carried out by Christer Hellstrand (1989) - originally a student from Madison. A number of years ago he went to work for SKF, the world's largest manufacturer of bearings, with plants in 14 different countries. Bearings are necessary for the countless sorts of machinery in which there are moving parts - washing machines - air-conditioners - cars and so forth. When Christer arrived, the engineers were preparing an experiment on a deep groove bearing to find out whether they could change to a different type of casing without affecting bearing life.
One of the production lines could be set aside for a short time to make the experimental runs. The original intention was to make about four runs with each type of casing using an accelerated life test as the chief means of assessing the data. Chrinster introduced them to the simple 2 factorial design and suggested that, while they were at it, they might add in a couple more variables. The two additional factors were a type of heat treatment and a modification of osculation (the extent to which the balls touch the casing).
The results were spectacular - Although varying each of the factors separately produced no significant changes, increasing osculation and heat treatment together resulted in a five-fold increase in bearing life. Now the company had been making bearings for many decades, so why had this affect not been discovered previously? Almost certainly the answer is that previously only one factor-at-a-time experiments were used. This and similar examples suggest that there are a large number of engineering phenomena resulting from similar interactions waiting to be discovered. The engineers were tremendously excited, but puzzled, by these results. They were contrary to what might have been expected using current engineering principles. The empirical discovery of a new phenomenon of this kind incites research to determine how current theory must be modified or augmented to accommodate it. This new understanding may then be applied not only to the current problem but also to solving other problems.
Studying the investigation process -learning how to learn
In 1948 my first job was with a large division of Imperial Chemical Industries in Manchester, England (DeGroot, 1987). They didn't quite know what to do with me but told me that my chief concern would be to find ways to improve their many processes. When I suggested that they should use experimental design, the chemists and engineers laughed at me. They said. "Oh we've tried that and it didn't work".
It turned out that they thought statistical experimental design meant choosing in advance all the important variables and then deciding how many levels were needed for each factor, and so covering the whole region of possibilities. They said they had started to run one or two of these arrangements, but they had quickly petered out. After looking at the results from a few runs they had realized, for example, that they should be using much higher temperatures and pressures; that some of the variables didn't seem to be doing anything, and others that ought to have been included. It was clear that I had a lot to learn about process experimentation.
So two chemists (K. B. Wilson and P. V. Youle) and I decided to watch what process improvement teams actually did and then see if we could find ways of doing it better. In particular we realized we must retain the iterative aspect. We knew, of course, about Wald - Barnard sequential hypothesis tests and also about the sequential application of Bayes theorem in which the posterior distribution for one phase becomes the prior for the next. These procedures although sequential are not iterative since they use a fixed model. But discovery usually means learning how to change the model.
The methods that we developed were themselves arrived at by an iterative process - or if you like from trial and error. They were developed from our observation of, and assistance with, a number of process improvement investigations. In what were later called response surface methods (Box and Wilson, 1951), we used Fractional Factorials (Finney, 1945) and Plackett-Burman Designs (1946) to discover which were the important factors, techniques such as Steepest Ascent to find out where we should be in the factor space, Sequential Assembly (Box, 1993) to discern an adequate functional approximation, and Partial Replication when we needed to find out more about the size of the experimental error. Initially a fairly small experiment would be put down and what we did then would depend on what we saw. The process is illustrated in Figure 1 and is shown for just three factors, but frequently, of course, it occurs in many more dimensions.
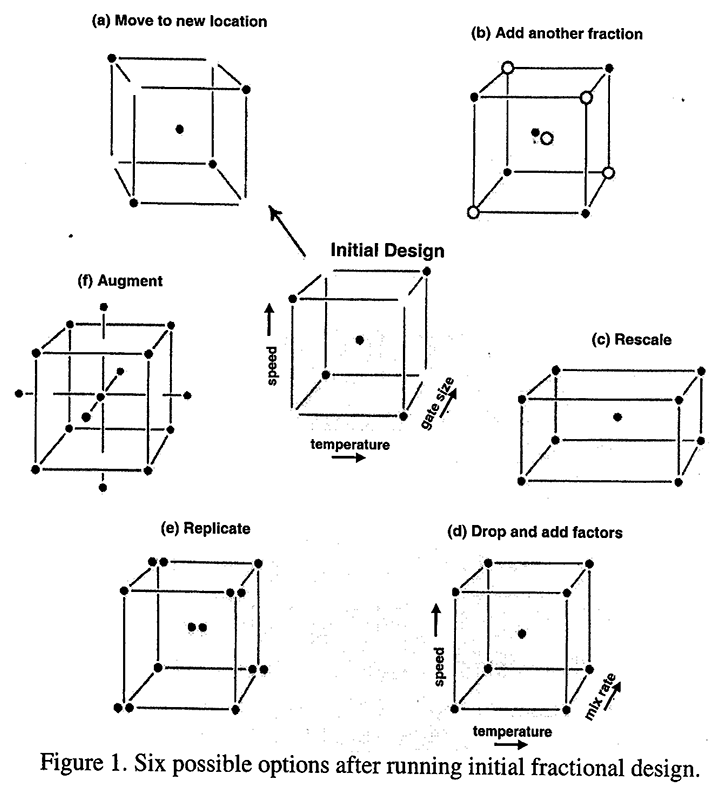
In the figure is shown how, from an initial fractional factorial, we might move to a different location, decide to add a further fraction, to rescale, to change certain of the variables, to partially replicate some points, or to augment the design to make it possible to look at higher order approximations.
The process of sequential assembly I mentioned above is an essential part of this process. In particular after running a two-level fractional factorial it's possible that the problem might be solved. But if it appeared that we needed more information we might add a second fraction or additional runs to resolve ambiguities could be chosen using, for example, methods discussed by Meyer, Steinberg and Box (1996), the finding of interactions as large or greater than the main affects could suggest the need for a second order design which could be obtained by adding axial points to allow us to look at curvatures and perhaps to discover a maximum or a ridge system. Such sequential assembly allows us to match the experimental effort to the difficulty of the problem. Simple problems get solved with less effort and more complicated problems require greater effort.
I mentioned earlier that statistical methods appropriate for iterative inquiry can help the investigator not only to answer questions originally asked but also to catalyze the posing of new questions. Thus greatly assisting the subject matter specialist's attempt to understand the phenomenon under study.
Problems of the investigator and howstatistics can help
The use of induction and deduction neededfor iterative enquiry is a different art. To conceptualize what is going on the investigator must consider simultaneously how each of a number of responses are affected by each of a number of factors. By combining this information with subject matter knowledge it may then be possible for the investigator to postulate empirical or physical models that could explain what is happening and hence to decide how the investigation should best proceed. But evidence generated by ad hoc experiments or one factor at a time experimentation or by alphabetic optimality is likely to be unnecessary confusing and so can abort the process of exploration and discovery or make it much more difficult or expensive that it need be. The informed use of experimental design to suitably structure the getting of data greatly helps the processes of finding which are the important factors driving each response and estimating their separate and joint effects and so reinforcing the investigators' basis for conjecture.
It is here that statistical help would be most welcomed by the engineering and physical scientists. Unfortunately it is quite likely their opinion of statistics by taking a typical elementary course consisting in exercises of probability theory and emphasizing hypothesis testing which they see an being of little help of what they are doing.
The use of Statistical design to help decide how to proceed.
In addition to their other well-known advantages, structured designs are extremely important in helping with the task of looking forwards, as well as backwards. One of the most basic things that the brain is able to do is to identify whether things are the same or different. In particular, factorial arrangement is a superb "same or different machine". For example in a simple 23 factorial represented by the vertices of a cube, there are no less than 12 different comparisons that can be made (along the edges) in which only one factor has been changed. Ad hoc experiments and alphabetical optimal designs seldom have this property.
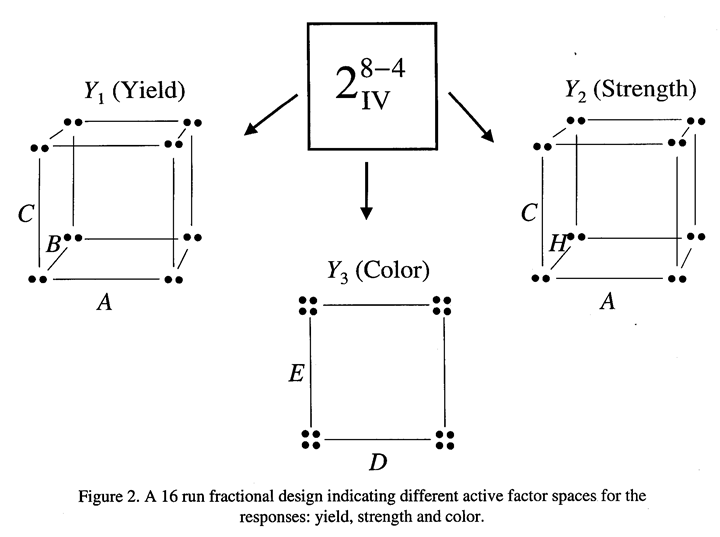
A further very important characteristic of fractional factorial designs is their projective properties (Box and Hunter, 1961a, b). Now the Pareto principle* says that out of a larger number of factors it is very likely there are only 2 or 3 that are of much importance. Projection and the Pareto Principle are a natural partnership that greatly helps in the untangling of complex relationships. For example, suppose we need to study eight factors and we employ a 16 run  design; this design will project into a 23 complete factorial replicated twice no matter which 3 variables are the important ones. This is remarkable because there are 56 different ways of choosing 3 factors out of eight. Now usually the experimenter would be measuring several responses at each of the sixteen factor combinations. As illustrated in Figure 2, the design might show, for example, that factors A, B and C are most important in determining yield y1 but that for variables E and D. Linking specific responses to their active factor spaces is of itself of tremendous inductive value.
*Also called the principle of parsimony or Occam's razor.
Demonstrating Iterative Discovery
Unfortunately, I find it very hard to get statisticians to free themselves from the familiar philosophy of the fixed frame. I was asked fairly recently to take part in a discussion about response surface methods, which was later published in the Journal of Qualify Technology (Box, 1999). Although I was certain that many of my audience would have designed individual experiments I was less sure that they had been involved in iterative experimentation when you don't know a priori where the investigation is going - being part of a team developing a new idea, such as, designing a new color printing or developing a new drug.
To gain such experience I suggested that they take part in designing a paper helicopter* with a longer flight time. This device can also be used to acquaint students with the process of iterative discovery. Typically they work in small learns of two or three. Each team can start with whatever design of helicopter they prefer and they can vary whatever factors they like in whatever design they like. As a demonstration of this process, Patrick Liu and I set out the particular sequence of events that occurred in an investigation that we ran (Box and Liu, 1999).
In our case we started with the standard prototype paper helicopter, chose 8 factors to begin with, and explored their effects using a 2 factorial design. From this initial experiment it was pretty clear that of the factors we had studied it was the dimensional variables that were of greatest importance. These factors were the wing length, the body length and the body width of the helicopter (Figure 3a). Now at this point, one can imagine a statistician telling the experimenter, that wing length, body length and body width had significant effects - and leaving it at that.
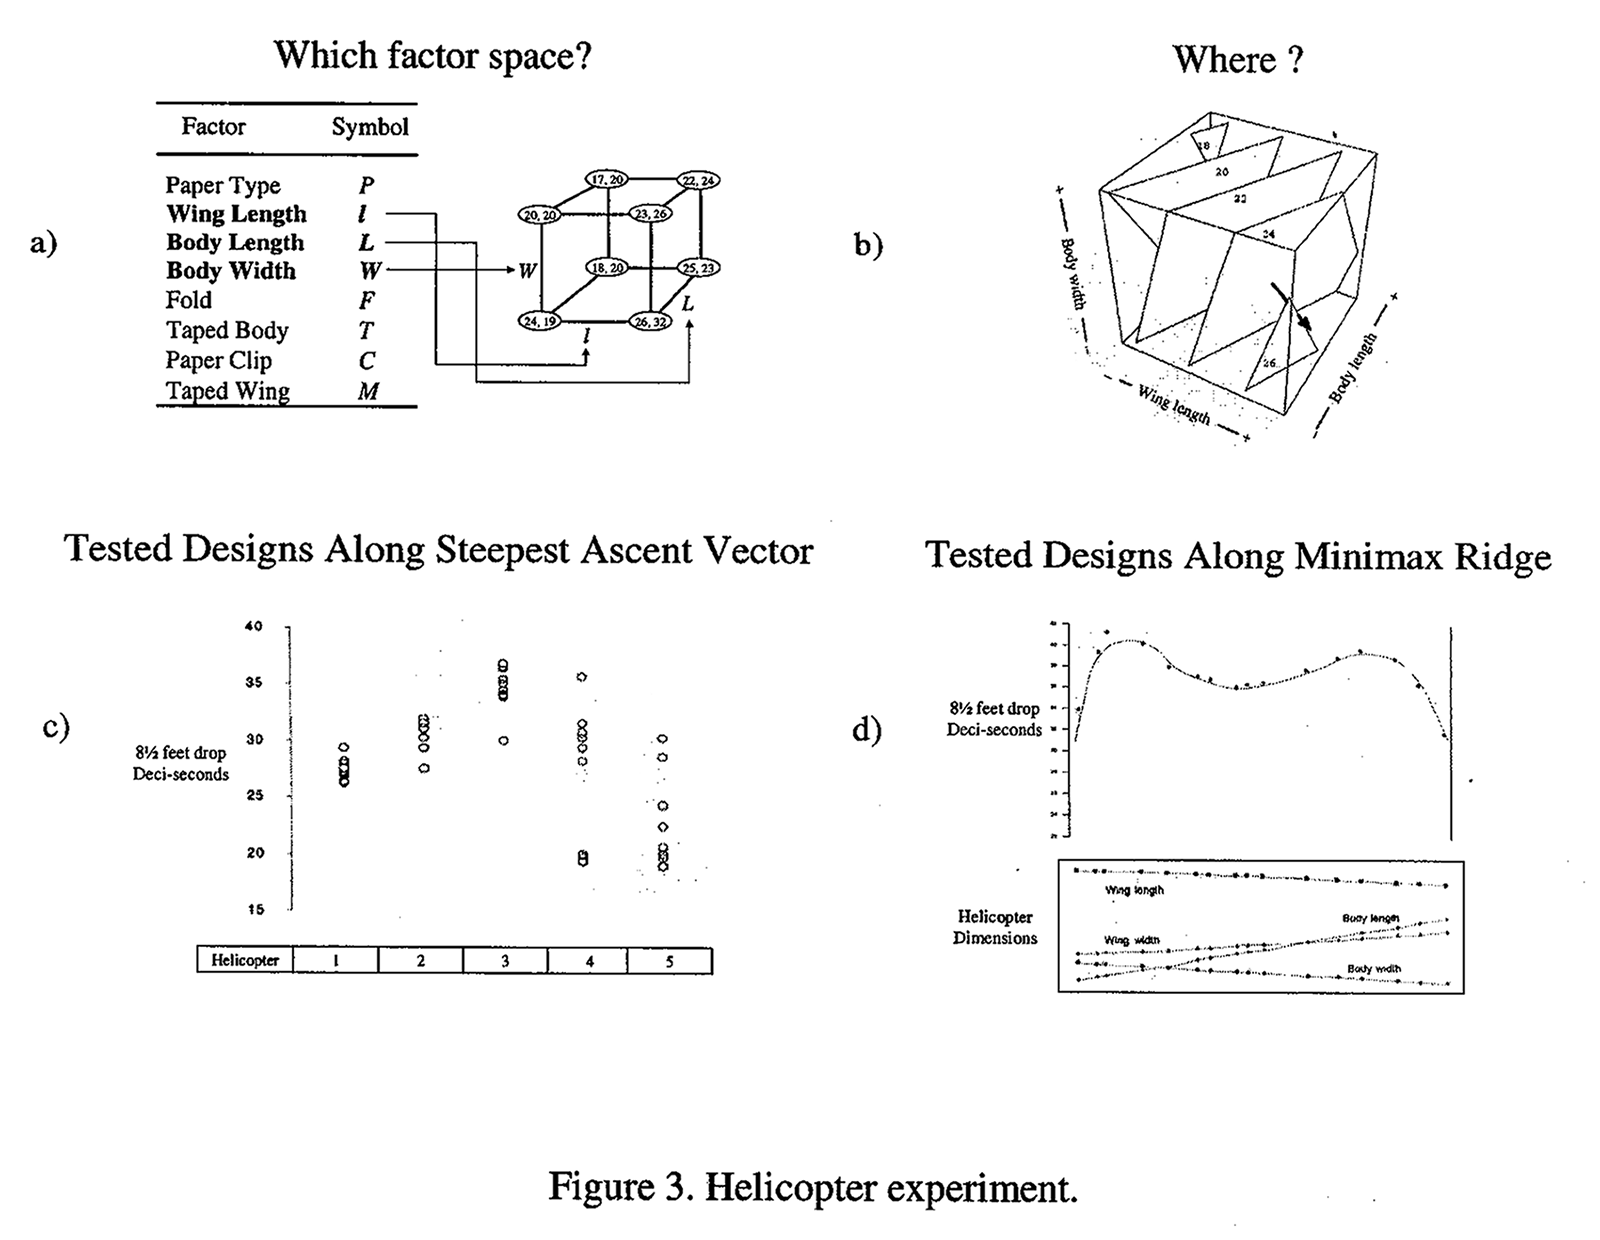
But, what the statistician should be doing is helping to answer the question: What should we do now? In particular it would usually be of interest to determine what would happen if we further increased the wing length, reduced the body length, and reduced the body width in accordance with the affects that had been found; exploring the direction of steepest ascent shown in Figure 3b. Figure 3c shows the performance of helicopter designs along this extrapolated line. We had started off with a helicopter that flew for about 20 deci-seconds. But as we moved along this path we could get an average of about 34 deci-seconds. That was a big advance.
In an industrial context after improvement of this magnitude a manufacturer might say, "Well that's good enough for now. It's much better than what anybody else is doing". In our investigation we went further and, after being led to what appeared to be a near-stationary region, we found that flight times could be approximated by a second degree equation in the four helicopter dimensions. We expected that analysis of this equation would show a maximum in all four dimensions. However we found from an eigenvalue eigenvector analysis that in one direction a minimum occurred. As is shown in Figure 3d, along that vector there were, in fact, two different types of helicopter designs both of wich gave very good flight times, but which were quite different. The fact that we found two good designs is not at all surprising for it is common for engineers to find more than one solution to a problem. It is hardly necessary to emphasize that the designs that we found were not "optimal". If readers can be persuaded to run experiments of their own they can almost certainly do better.
*Methods of demonstration other than with the paper helicopter could of course be used. The essential thing is that there is not artificial limit to the possibilities to change in the design of the product. For example, some catapult experiments able to demonstrate experimental design are not suitable to demonstrate iterative investigation because the factors that can be varied are built in and there is no room for imaginative development.
Now Wilson and I had intended that our work might be just a first shot at developing statistical techniques to catalyze iterative investigation and discovery. It is disappointing that at sessions on response surface methods that regularly occur at statistical meetings many speakers seem not to be developing any new methodology, but trying to squeeze some aspect of what is already known into a fixed frame. Why is this fixed frame mentality so seductive? I think it was a disastrous mistake to categorize statistics as a branch of mathematics. Certainly it uses mathematics, but so, for example, do chemistry, physics and genetics. It is much more than this. It is a science concerned with the problem of how new knowledge can be generated most efficiently.
Many statisticians, some of whom are developers of the subject have training only in mathematics and the mathematical paradigm "proposition-theorem proof" takes place within a fixed frame very close to this is the concept of "hypothesis-data-decision". Also within a fixed frame we can act as mathematicians. We can prove theorems, talk about axioms, coherence, and lay down mathematical foundations for our subject. But, iterative learning does not fit this frame. In the process of discovery the model is continually changing and it is severely limiting to think in these terms. For example, concerning the experiment in factors A, B, C, D and E that I mentioned earlier, there was no way of estimating the probability that a particular physical model would be suggested to the investigator requiring the introduction of new factors F and G. Unless we are to severely limit the scope of the subject we should not be talking of its mathematical foundations but rather thinking of it as an important aspect of the philosophy of good science.
Reform in the teaching of Statistics
So, I think we are missing a good bet. Appropriate statistical methods could greatly catalyze many investigations in engineering and the physical sciences. But, much of what we have been doing is adequate for testing but not adequate for discovery (see e.g. Tiao, 2000). New ideas in genuine statistics are unlikely to come from pure mathematical speculation (see e.g. Box, 1984). We must move the brick wall that too frequently separates statistics from engineering, the physical sciences, and from the world of problem solving and discovery.
To bring about this change I believe that some work in science or engineering should be a pre-condition for acceptance as a statistics student. When this condition is not met, suitable remedial courses would be required. Cooperative work with investigators resulting in new statistical ideas should be the criterion for the award of Ph.D's and faculty promotion. Ph.D. theses, of mainly mathematical interest, should be judged by the Mathematics Department.
In the past most teaching has been done by lecturing, using the brain for storage and retrieval of information. But in these days we have computers and the Internet. They are much more efficient for this purpose and they set the brain free to do what it does best and what machines cannot do-namely the creative solution of unstructured problems. The roles that statistics plays in learning and discovery will need o be taught by means much closer to the case study method. The teacher must act as a mentor helping the student to learn how to solve problems. In particular there are often several quite good solutions to a given problem. Much can be learned from students' presentations to each other of the different routes they took to their solutions. To make room in the statistics curriculum for these initiatives it will be necessary to severely cutting back on the courses currently taught. Those that remain must be carefully chosen and perhaps revised to better serve a wider vision of the subject.
Reform will affect applications, research, the nature of our teaching, the criteria for the allocation of grants, the mode of selection of teachers, the awarding of tenure, and the content of statistical journals.
We must earn the right to be regarded as valuable team members for iterative investigation. We want to get to the point where investigators say, "This is a difficult problem, we must get Joe Blow who knows some statistics to help."
Conclusions
The view that many statistics department take of the subject is a narrow one dominated by the concept that the importance of ideas old and new is measured by their mathematical rather than their scientific content. Not unnaturally the products of such thinking have little appeal to scientists and engineers involved in learning and discovery. Ways of remedying this situation are suggested and discussed.
References
- Box, G.E.P. (1982), "Choice of response surface design and alphabetic optimality," Utilitas Maxhemarica, 21B, 11 -55. Also in Proceedings of the Twenty-eight Conference of the Design of Experiments in Army Research Development and Testing, Report 83 - 2.
- Box, G.E.P. (1993), "Sequential experimentation and sequential assembly of designs." Quality Engineering, 5(2), 321 - 330.
- Box. G.E.P. (1994). "Statistics and quality improvement," Journal of the Royal Statistical Society, Series A, 157(Pt. 2), 209 - 229.
- Box, G.E.P. (1999), "Statistics as a catalyst to learning by scientific method. Part II," Journal of Quality Technology.
- Box. G.E.P. and Draper, N.R. (1975), "Robust designs" Biometrika, 62(2). 347 - 352.
- Box. G.E.P. and Hunter, J.S. (1961a), "The 2k-p fractional factorial designs. Pt. I," Technometrics, 3(3), 311 - 351.
- Box, G.E.P. and Hunter, J.S. (1961b), "The 2k-p fractional factorial designs, Pt. II" Technometrics, 3(4). 449 -458.
- Box, G.E.P. and Liu, P. (1999), "Statistics as a catalyst to learning by scientific method. Part I. An example," Journal of Quality Technology, 31(1). 1 - 15.
- Box, G.E.P. and Wilson, K.B. (1951), "On the experimental attainment of optimum conditions," Journal of the Royal Statistical Society. Series B, XIII(l), 1 - 45.
- Box, G.E.P. and Youle, P.V. (1955). "The exploration and exploitation of response surfaces: an example of the link between the fitted surface and the basic mechanism of the system," Biometrics, 11(3), 287 - 323.
- DeGroot, M.H. (1987), "A conversation with George Box," Statistical Science, 2(3), 239 - 258.
- Deming, W.E. (1986), Out of the Crisis. MIT, Center for Advanced Engineering Study, Cambridge, MA.
- Finney, D.J. (1945), "The fractional replication of factorial arrangements," Annals of Eugenics, 12(4), 291 - 301.
- Hellstrand, C. (1989), "The necessity of modern quality improvement and some experiences with it implementation in the manufacture of rolling bearings," Philosophical Transactions of the Royal Society, Industrial Quality Rel., 51 -56. Kiefer, J. (1959), "Optimum experimental designs," Journal of the Royal Statistical Society, Series B, 21, 272 - 319.
- Kiefer, J. (1975), "Optimal design: variation in structure and performance under change of criterion," Biometrika, 62, 277 - 288.
- Meyer, R.D., Steinberg, D.M. and Box, G.E.P. (1996), "Follow-up designs to resolve confounding in multifactor experiments", Technometrics, 38(9), 303 - 313.
- Plackett R.L. and Burman, J.P. (1946), "The design of optimum multifactorial experiments," Biometrika, 33, 305 - 325 and 328 - 332.
- Tino, G. (cd.) (2000), Box on Quality and Discovery, Wiley, New York.