Articles and Reports by George E.P. Box
williamghunter.net > George Box reports > Teaching Engineers Experimental Design with a Paper Helicopter
Teaching Engineers Experimental Design with a Paper Helicopter
Copyright © 1991 by George E. P. Box. Used by permission.
Abstract
How a paper "helicopter" made in a minute or so from 8 1/2" x 11" sheet of paper can be used to teach principles of experimental design including - conditions for validity of experimentation, randomization, blocking, the use of factorial and fractional factorial designs, and the management of experimentation.
Keywords: Randomization, blocking, factorial, fractional factorial, and experimental design
How a paper "helicopter" made in a minute or so from a 8 1/2" x 11" sheet of paper can be used to teach principles of experimental design including- conditions for validity of experimentation, randomization, blocking, the use of factorial and fractional factorial designs, and the management of experimentation.
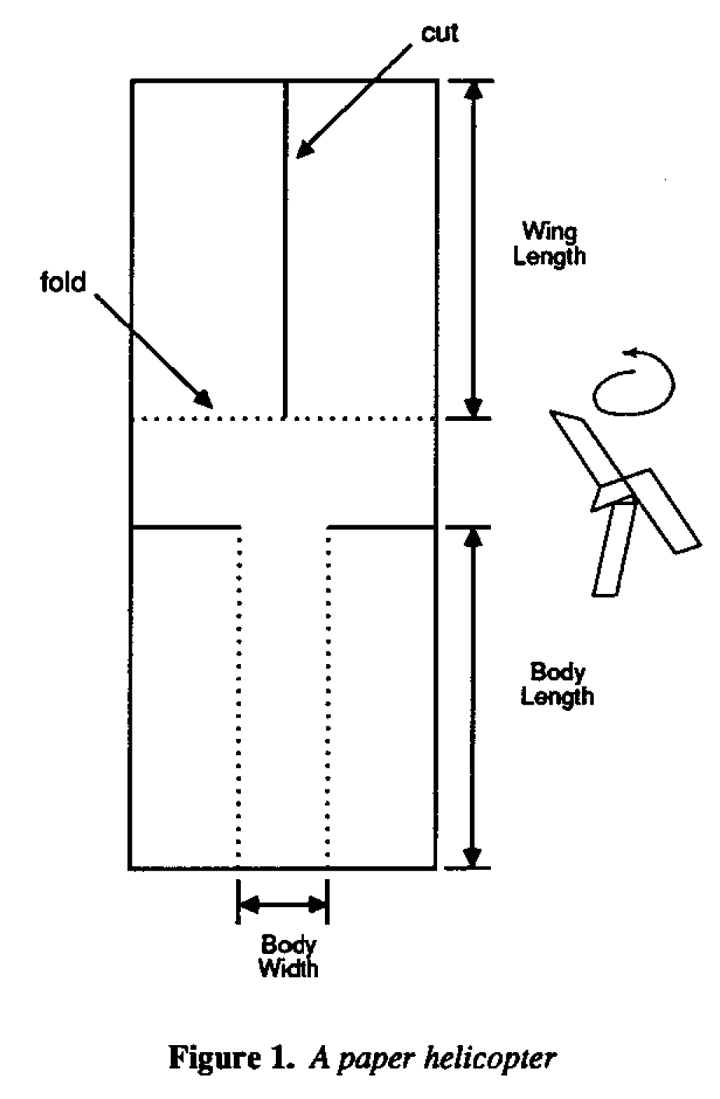
When Søren Bisgaard, Conrad Fung and I teach engineers about designed experiments, we find it very valuable to use a paper helicopter for illustration. We were introduced to this idea some years ago by Kip Rogers of Digital Equipment. Using the generic design shown in Figure 1 a "helicopter" can be made from an 8 1/2 x 11 sheet of paper in a minute or so.

The scenario I'll describe requires three people whom I'll call Tom, Dick, and Harry. To make an experimental run Tom stands on a ladder and drops the helicopter from a height of twelve feet or so while Dick times its fall with a stopwatch. We explain to the class that we would like to find an improved helicopter design which has a longer flight time. The helicopter can then be used to illustrate a number of important ideas.
Variation
We start by Tom dropping a helicopter made from blue paper. He drops it four times and we see that the results vary somewhat. This leads to a discussion of variation and to the introduction of the range and the standard deviation as measures of spread, and of the average as a measure of central tendency.
Comparing Mean Flight Times
At this point Dick says "I don't think much of this helicopter design, I made this red helicopter yesterday and dropped it four times and I got an average flight time which was considerably longer than what we just got with the blue helicopter. So we put up the two sets of data, for the four runs made with the blue helicopter and the four runs made with the red helicopter, on the overhead projector and we show the two sets of averages and standard deviations. Eventually we demonstrate a simple test that shows that there is indeed a statistically significant difference in means, in favor of the runs made with die red helicopter.
Validity of the Experiment
At this point Harry says "So the difference is statically significant. So what? It doesn't necessarily mean it's because of the different helicopter design. The runs with the red helicopter were made yesterday when it was cold and wet, the runs with the blue helicopter were made today when it's warm and dry. Perhaps its the temperature or the humidity that made the difference. What about the paper? Was it the same kind of paper used to make the red helicopter as was used to make the blue one? Also, the blue helicopter was dropped by Tom and the red one by Dick. Perhaps they don't drop them the same way. And where did Dick drop his helicopter? I bet it was in the conference room, and I've noticed that in that particular room there is a draft which tends to make them fall towards the door. That could increase the flight time. Anyway, are you sure they dropped them from the same height?" So we ask the class if they think these criticisms have merit and they mostly agree that they have, and they add a few more criticisms of their own. They may even tell us about the many uncomfortable hours they have spout sitting around a table with a number of (possibly highly prejudiced) persons arguing about the meaning of the results from a badly designed experiment.
We tell the class how Fisher once said of data like this that "nothing much can be gained from statistical analysis about all you can do is to carry out a postmortem and decide what such an experiment died of." And how, some seventy years ago, this led him to the ideas of randomization and blocking which can provide data leading to unambiguous conclusions instead of an argument. We then discuss how these ideas can be used to compare the blue and the red helicopter by making a series of paired comparisons. Each pair (block) of experiments involves the dropping of the blue and the red helicopter by the same person at the same location. you can decide which helicopter should be dropped first by, for example, tossing a penny. The conclusions are based on the differences in flight time within the pairs of runs made under identical conditions. We go on to explain however that different people and different locations could be used from pair to pair and how, if this were done "it would widen the inductive basis" as Fisher (1935) said, for choosing one helicopter design over the other. If the red helicopter design appeared to be better, one would, for example, like to be able to say that it seemed to be consistently better no matter who dropped it or where it was dropped. As we might put it today we would like the helicopter design to be "robust with respect to environmental factors such as the 'operator' dropping it and the location where it was dropped." This links up very nicely with later discussion of some of the ideas of Taguchi.
A Fractional Factorial Design
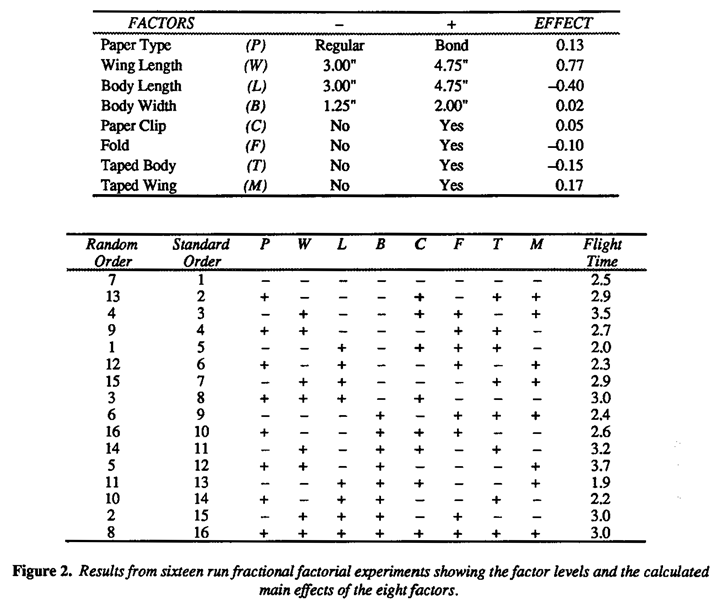
Later on in the class we use the paper helicopter to illustrate the running of a fractional factorial(orthogonal array) design. We suppose that a brainstorming session by an engineering design team on ways of improving the helicopter flight time has resulted in the selection of eight factors to be studied in a designed experiment. These selected factors are listed at the top of Figure 2 together with the two conditions (indicated by minus and plus signs) at which each will be tested. It is thought likely that only a few of these factors will have important large effects. We are thus in the familiar "Pareto" situation where, as Dr. Juran says we want to screen out the vital few from the trivial many." The design, shown in Figure 2, is a fractional factorial design. Bisgaard (1988) provides a very useful table of this and other eight and sixteen-run designs with a succinct description of their properties and analysis. Such designs which were developed in England during and just after World War II, are particularly useful for this purpose of screening, and this one which is a 1/16th fraction of the full 28 (256 run) design has two very valuable properties (see for example Box, Hunter & Hunter (BH2, 1978).
- if there are interactions between pairs of factors they will not bias any of the eight main effects Of the factors;
- if only up to three factors are of importance, the design will produce a complete 23 factorial design replicated twice in those three factors no matter which ones they are.
This latter property is particularly remarkable when we consider that there are fifty-six different ways of choosing three factors from eight. You can check it for yourself by picking any three columns in the design of Figure 2 and verifying that whichever three you pick you have every combination of (±,±,±) in those factors repeated twice over.

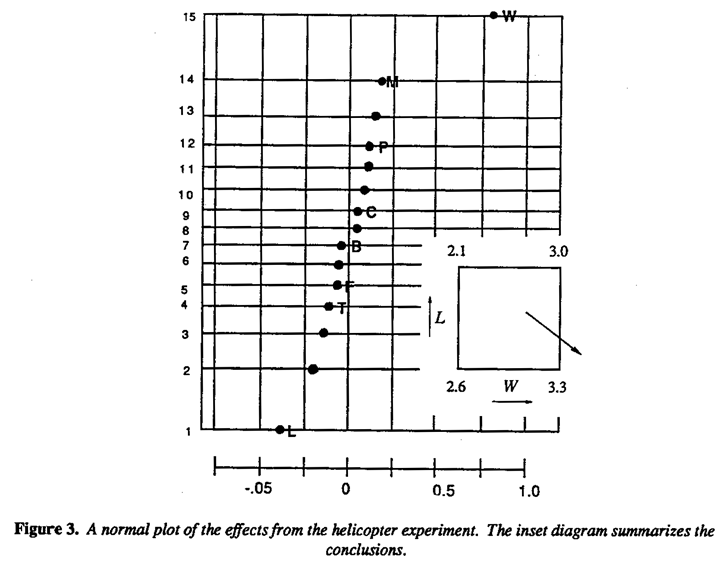
Flight times for the sixteen helicopter types obtained from an experiment run in random order are shown in Figure 2. From these flight times, eight main effects and seven strings of two factorial interaction effects may be calculated.* These are plotted on probability paper in Figure 3 suggesting that real effects are associated with W (wing length) and, less Certainly, L (body length). On the basis that the remaining effects falling around the straight-line are mostly due to noise, we can summarize the data simply in terms of the inset diagram in Figure 3. Going back to the original data it will be seen, for example, that there are four runs with short wing length and short body length with flight times averaging 2.6 seconds and four runs with long wing length and that body length averaging 3.3 seconds and so on. These averages are set out at the corners of the square in the inset diagram.
A direction in which one might expect still Ionger flight times by using larger wings with a shorter body is indicated by the arrow. Thus the experiment immediately provides not only an improved helicopter design but also indicates the direction in which further experimentation should be carried out and so demonstrates the value of the sequential approach to experimentation -learning as you go.
Another aspect of this approach is highlighted by discussing with the class whether they are satisfied with flight time as the sole criterion. In earlier lectures we have emphasized to the class that what happens in each run of an experiment must be carefully documented - for example the fact that Helicopter #7 hit the table leg and that run had to be repealed. Such careful observation might suggest, for example, that an additional criterion that should be included in future experimentation was flight stability. This teaches the Lesson that the criteria to be used in assessing the results may need to be modified or totally changed during as investigation as we learn more of the phenomena under study. Appropriate and feasible objectives cannot always be determined in advance.
*It is supposed in this analysis that interactions between three or more factors can be ignored. A fuller discussion of such analyses can be found, for example, in BH2 p. 402.

Management of Experimentation
In running an experiment as complex as this, the safest assumption is that, unless extraordinary precautions are taken, it will be run wrongly. Therefore the opportunity should be taken of getting the class involved in the careful organization of the experiment. In particular, members of the class should be assigned to systematically check, and recheck independently, that each one of the sixteen helicopter designs to be flown exactly corresponds to the specification set out in the appropriate row of Table 2. Our course for engineers lasts only a few days so we find it necessary to prepare the paper helicopters in advance. After the preliminary explanation and the careful checking, the actual running of the experiment takes less than six minutes.
No elaborate analysis is needed for two-level experiments of this kind and certainly no Analysis of Variance table, which at this stage and for this purpose serves only to waste time and confuse the class. In earlier discussions, members of the class have already satisfied themselves, by one or two had calculations, that factorial effects are just the differences between the average results at the plus and minus levels of a given factor. Also the rationale of Daniels normal plot has already been explained. So for the helicopter experiment we enter the data in the computer as it becomes available and use the SCA program to calculate the effects at once, and to produce the normal pics which is immediately projected onto the overhead screen.
We find that participatory demonstrations of this kind even with such a simple device 55 a paper helicopter seizes the imagination of the engineer and produces very rapid learning.
Acknowledgments
This research was sponsored by the National Science Foundation under Grant No. DDM-8808138.
References
Box. G.E.P.. Hunter. W.G., and Hunter. J.S., Statistics for Experimenters. New York: John Wiley. p. 398. 1978.
Bisgaard. S., A Practical Aid for Experimenters.Starlight Press, Madison, Wisconsin, 1988.
Fisher, RA., The Design of Experiments. Oliver and Boyd, Edinburgh and London. 1935.