williamghunter.net > George Box articles > What Can You Find Out from 12 Experimental Runs?
What Can You Find Out from 12 Experimental Runs?
Copyright © August 1992, George E.P. Box, Søren Bisgaard. Used by permission.
Abstract
Previous columns have shown how 8 and 16 run two level factorial designs could be used to study a number of factors. In particular they could be used to generate fractional factorial designs whose projective properties made them excellent screening designs for finding a few vital factors having major effects on a system. These fractional designs are particular examples of orthogonal arrays developed by Plackett and Burman which are available when N is a multiple of 4. In particular these authors derived such a design to study 11 factors in 12 runs. It turns out that this design has the remarkable property that it yields a full 23 factorial plus an additional optimal half replicate for any of the 165 choices of 3 factors out of the 11 factors tested.
Keywords: Projective Properties, Plackett Burman Designs, Orthogonal Arrays.
Recent columns1,2,3 have illustrated the value of two-level 8 run and 16 run fractional factorial designs. In particular (see also4 BH2 page 389) it was shown that because of their "projective" properties they could be used for screening a number of candidate variables to find the vital few which had major effects on the system. It was also pointed out that the plusses and minuses in the columns of these designs were in perfect balance and that consequently they were examples of "orthogonal arrays." Now while all such fractional factorial designs are "orthogonal arrays" not all orthogonal arrays are fractional factorials.
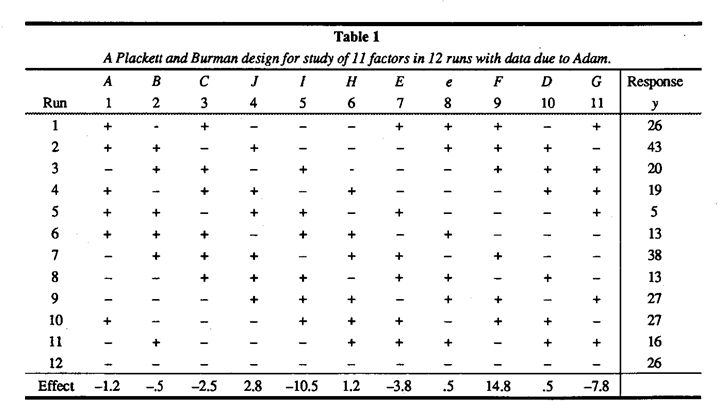
In particular, Table 1 shows a useful 12 run design which, although not a simple fraction of a factorial design, has perfect orthogonal balance. To see this you can check that opposite the six plus signs hi any given column are 3 plusses and 3 minuses in every other column and similarly for the six minus signs. This design is sometimes referred so as an L12 orthogonal array. Orthogonal arrays of this kind were discovered, used, and tabulated by two English statisticians, Robin Plackett and Peter Burman4 during WWII. They were developed in response to the need to study many variables in the development of an anti-aircraft proximity fuse. These authors showed that their designs could be obtained when the number of runs N is a multiple of 4, whereas orthogonal arrays can only be derived from fractional factorials when N is a power of 2 (eg. N= 4, 8, 16 ...).
The design for N=12 ti what is called a cyclic structure. For suchs designs it is easy b write down a whole design matrix once we have the first row. You can see from Table I that the second row is the same as the first moved once one step to the right (the sign left over at the end of the row is the first sign of the new row). This "cyclic" shifting produces the first 11 rows, and the last row is just a row of minus signs. The designs with N=20 (L20) and N=24 (L24) are also cyclic designs with first rows:
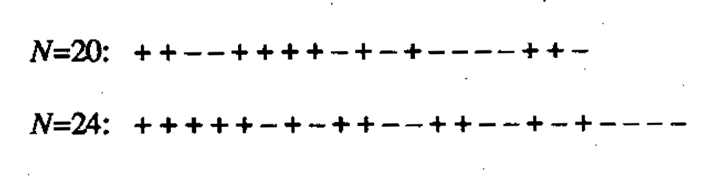
The interested reader will find larger designs in the original reference. Plackett and Burman4, and later C. R. Rao6 also produced orthogonal arrays for more than two factor levels.
For illustration we re-analyze some data due to Adam5. He used the L12, design to said the effect of ten factors denoted by A, B, C, D,... , J, which might affect surface defects on automobile instrument panels. Since the data are based on counts of defects, the square root of the counts are most likely to be appropriate for analysis (for an explanation, see for example7 B H2. page 144). These square roots multiplied by ten are shown as the response y in Table 1. Note that Adam's design has the tows and columns of the L12, arranged in different orders and we have appropriately taken account of this.
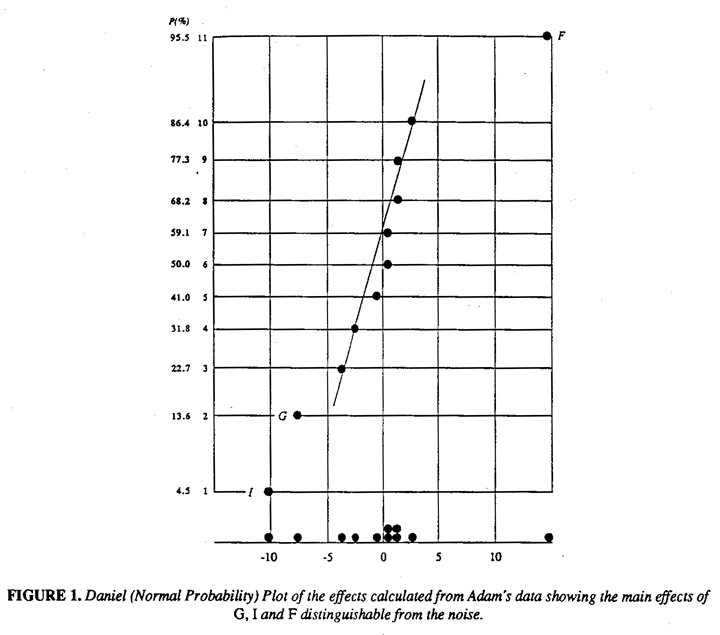
The rationale for using this design was most likely that only main effects would be of importance. This assumption can be risky8, but for the moment we will also proceed on this basis. The calculated effects for the factors and for the error column e are shown beneath the table and plotted on probability paper as a Daniel Plots9 in Figure 1. We see that factors F, 1, and G stand out clearly from the noise and this is in agreement with Adam's conclusion.
Projective properties of the design
It we now plut the 12 data points on a cube whose axes are three variables F, I, and G, we obtain Figure 2. From the figure we notice a remarkable fact. The design "projected" into the space of F, I and G forms a complete cube (a complete 23 factorial in F, I and G) with half the points repeated. Furthermore, the repeated points provide a fractional factorial capable of estimating the main effects of the factor F, I, and G on its own, so reinforcing the main effects estimates.
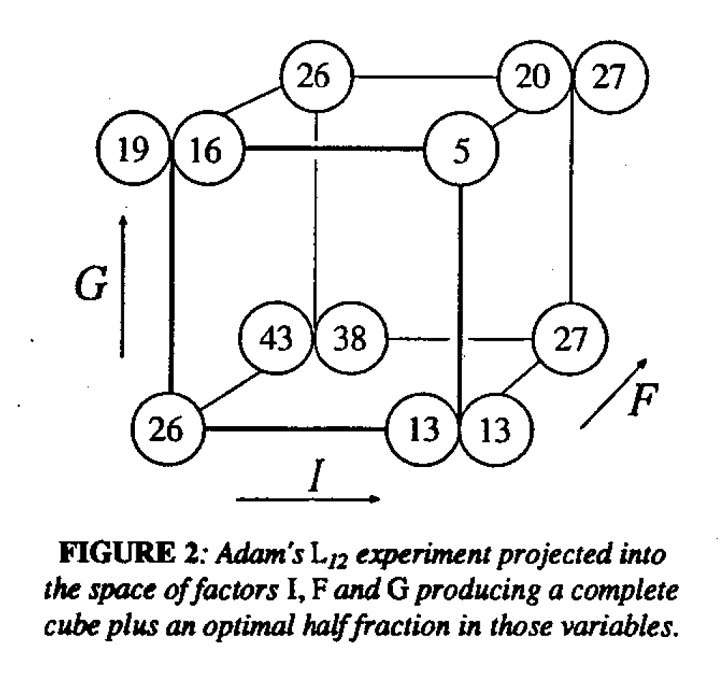
Now there are 165 different ways of choosing three factors out of 11 and it turns out that every one of these "projections" produces a complete factorial plus an additional half replicate of the kind we see in Figure 2. So whichever three factors turn out to be important, we will have a complete factorial in these three factors with four points replicated which optimally reinforce the estimates of the main effect. (See also Lin and Drapper10). This is an example of the surprising projective properties of Plackett - Burman designs which have great simplicity even though the alias structure11 for these designs is complicated. A more sophisticated analysis of designs of this kind in which the possibilities of interaction effects is not ruled out is discussed by Box and Meyer12. Notice a clue to which are the important factors is provided by the consideration of which points an approximately replicated.
Conclusions
- Adam's data provide an excellent example of the use of a Plackett and Burman design. The example was, however, presented in a context displaying the supposed superiority of Taguchi methods over classical methods. In fact, the contribution of Taguchi's ideas to this example was confined to the analysis. Adam performed using a signal-to-noise ratio and an analysis of variance. We believe however that the analysis of Figure 1 is much simpler mid of great validity13.
- In the past, there has sometimes been a reluctance to use Plackett and Burman designs for Industrial experimentation because of their extremely complicated alias structure in particular every main effect is aliased with portions of many two-factor interactions. However, the interesting properties of these designs (which we discovered several years ago) but whose importance seems to have gone unnoticed, provides a compelling rationale for their use.
Acknowledgment
This research was supported by a grant from the Alfred P. Sloan Foundation.
Rerferences
- Box, G. (1992), "What Can You Find Out From Eight Experimental Runs?"Quality Engineering. 4(4)619-627.
- Box, G. (1992), What Can You Find Out From Sixteen Experimental Runs" Quality Engineering, to appear.
- Box, G. (1991), "Teaching Engineers Experimental Design with a Paper Helicopter" (link is to CQPI version), Quality Engineering, 4(3), 453-459.
- Plackett, R. L., Burman, J. P. (1946), "The Design of Optimum Multifactorial Experiments," Biometrika, 33, 305-325.
- Adam. C. G. (1987), Instrument Panel Process Development", Fifth Symposium on Taguchi Methods, pp 93-106. Also reprinted in Taguchi Methods: Case Studies from U.S. and Europe, 1989, edited by G. Taguchi and Y. Wu., Deaborn. MI: ASI Press.
- Rao, C. R. (1947). "Factorial Experiments Derivable from Combinatorial Arrangements of Arrays." Journal of the Royal Statical Society, Supplement, 9, 128-139.
- "BH2 Box, G. E. P., Hunter, W. G. and Hunter, J. S. (1978). Statistics for Experimenters. New York: John Wiley Sons.
- Box, G. (1990), "Do Interactions Matter?" (link is to CQPI version) Quality Engineering, 2(3), 365-369.
- Daniel, C. (1976). Applications of Statics to Industrial Experimentation. New York John Wiley Sons.
- Lin, K.J. and Draper, N.R. (1992), "Projection Properties of Plackett and Burman Designs," Technometrics, No. 4, pp. 423-428
- Margolin, B. H. (1968), "Orthogonal Main-Effect 2n 3m Designs and Two-Factor Interaction Aliasing," Technometrics, Vol. 10, No.3, pp 559-573.
- Box, G.E.P. and Meyer. R.D. (1992). "Finding The Active Factors in Fractional Screening Experiments," Journal of Quality Technology, to appear.
- Box, G.E.P. (1988), "Signal-to-Noise Ratios, Performance Criteria, and Transformations," Technometrics, 30, 1-17. With discussion 18-40.